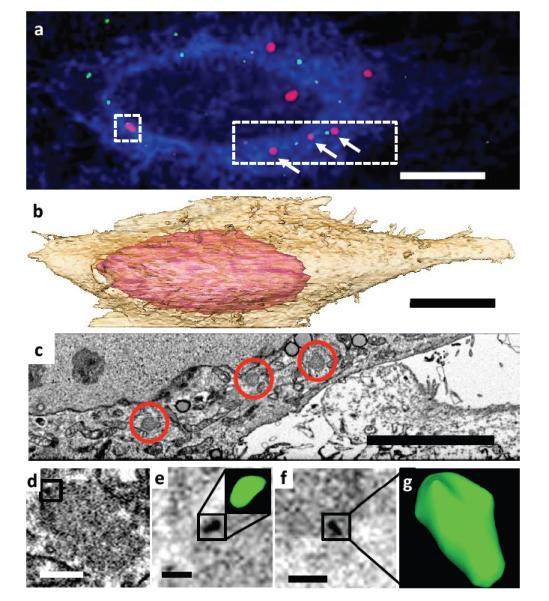
Figure 3. Identification of cytoplasmic HIV cores.

(a) Fluorescence image of HeLa-TRIM5αYFP cells (membrane, blue; TRIM5α, red) infected with HIV-Vpr-mCherry (green). Scale bar 10 μm. (b) Segmented representation of the 3D volume of the entire cell shown in (a), reconstructed from keyframe images. Scale bar 10 μm. (c) Single xy plane from 3D EM volume (collected at 4 × 4 × 12 nm) corresponding to dotted area in (a). Individual TRIM bodies are circled in red, corresponding to TRIM bodies indicated by white arrows in (a). Scale bar 5 μm. (d) Correlated image slice from high resolution “region of interest” image stack containing TRIM5α-associated HIV corresponding to square boxed region in (a), with putative core boxed. (e) Scale bar 400 nm., (e-g) Oblique image planes indicating detection and visualization of individual HIV cores with bent (e, corresponding to boxed area in d) and canonical (g) shapes. Scale bar 200 nm.
