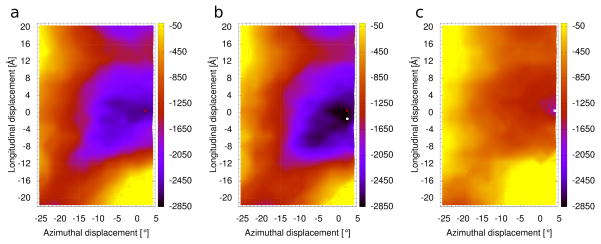
Figure 3.
Coulombic interactions (kcal/mol) landscape for actin mutants. (a) Wild-type actin (same as Fig. 1c). (b) D292V actin. (c) K326N actin. White dots indicate the location of the minima for the mutant filament landscapes and red crosses the position of the minimum for wild-type, as in Figure 1c.

