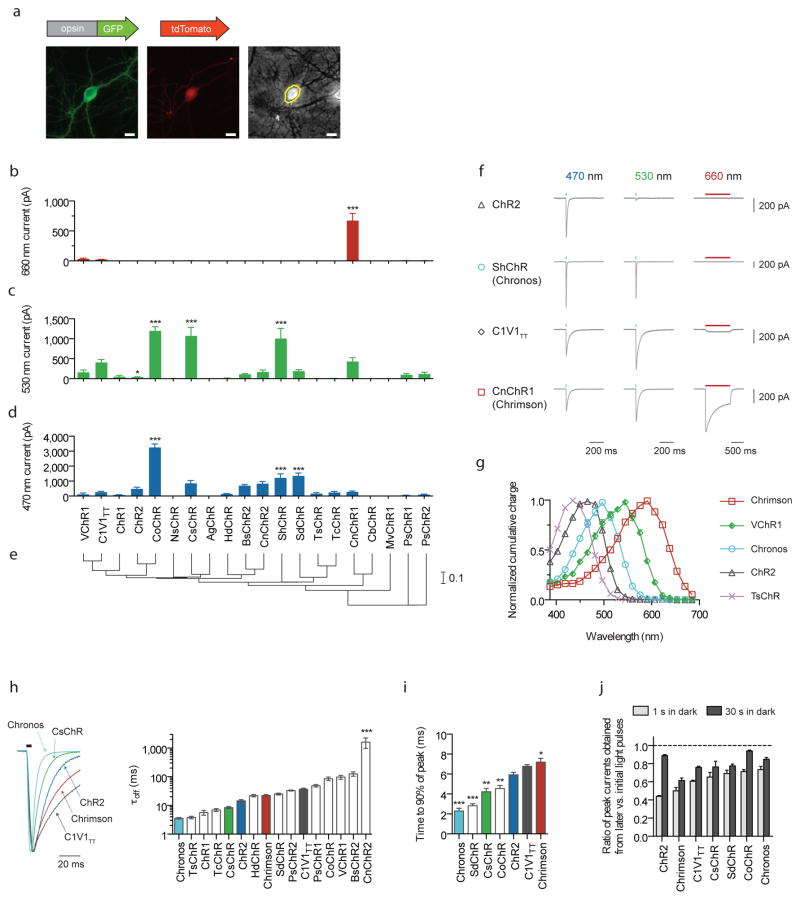
Figure 1. Novel channelrhodopsin spectral classes discovered through algal transcriptome sequencing.
(a) Representative GFP (left), tdTomato (middle) and phase contrast (right) images of a tdTomato and opsin-GFP fusion transfected neuron. Yellow line indicates the mask boundary used to quantify soma fluorescence. Scale bar is 10 μm. (b–d) Maximum photocurrents in cultured neurons in response to far-red (660 nm), green (530 nm) and blue (470 nm) light; blue and green photon fluxes were matched, with illumination conditions defined as follows: 1 s pulse at 10 mW/mm2 for red, 5 ms pulse at 3.66 mW/mm2 for green, and 5 ms pulse at 4.23 mW/mm2 for blue. n = 5 – 12 cells for channelrhodopsins with nonzero photocurrent for at least one color; n = 2 – 6 cells for opsins that did not exhibit any photocurrent. See Supplementary Fig. 6 for individual cell data. Plotted is mean ± standard error of the mean (s.e.m) throughout. (e) Phylogeny tree based on transmembrane helix alignments. Scale is # of substitutions per site. (f) Representative voltage-clamp traces in cultured neurons as measured under the screening conditions in b–d (the longer red light pulse was used to ensure we did not miss any red-sensitive channelrhodopsins in our screen). (g) Channelrhodopsin action spectra (HEK293 cells; n = 6 – 8 cells; measured using equal photon fluxes, ~2.5 × 10²¹ photons/s/m2). (h–j) Channelrhodopsin kinetic properties as measured in cultured neurons. Off-kinetics (h) were measured under the same conditions as b–d; on- (i) and recovery-kinetics (j) were measured with 1 s pulse at 5 mW/mm2. All opsins were illuminated near their respective peak wavelength, which was either blue or green for all opsins except Chrimson, which was characterized at 625 nm (n = 5 – 12 cells for all kinetic comparisons). (h) τoff is the monoexponential fit of photocurrent decay. (i–j) Raw traces are shown in Supplementary Fig. 7, and further details in Supplementary Fig. 8. (j) Peak current recovery ratios determined from three 1 s light pulses, with the first pulse response used as the baseline for peak current recovery ratio calculations for both second (1 s in dark after first pulse) and third pulse response (30 s in dark after second pulse). Opsin/genus/species names are: VChR1 (Volvox carteri), C1V1TT (VChR1/ChR1 chimaera), ChR1 (Chlamydomonas reinhardtii), CsChR (Chloromonas subdivisa), AgChR (Asteromonas gracillis-B), ChR2 (Chlamydomonas reinhardtii), CoChR (Chloromonas oogama), NsChR (Neochlorosarcina sp.), ShChR (Stigeoclonium helveticum; also called Chronos), MvChR1 (Mesostigma viride), SdChR (Scherffelia dubia), TsChR (Tetraselmis striata), TcChR (Tetraselmis cordiformis), BsChR (Brachiomonas submarina), CnChR (Chlamydomonas noctigama; also called Chrimson), HdChR (Haematococcus droebakensis), CbChR (Chlamydomonas bilatus-A), PsChR (Proteomonas sulcata). Statistics for panels b, c, d, h, and i: *P < 0.05, **P < 0.01 and ***P < 0.001; ANOVA with Dunnett’s post hoc test, with ChR2 as the reference in d, h, i, and C1V1TT as the reference in b and c. Plotted is mean ± standard error of the mean (s.e.m.) throughout.

