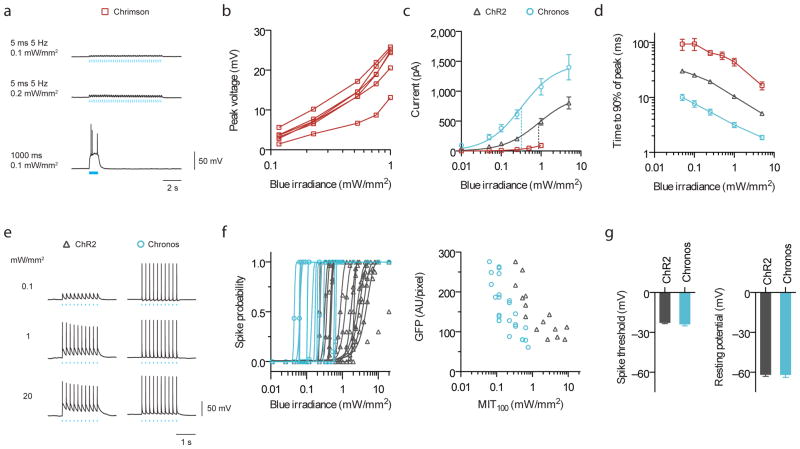
Figure 4. Characterization of channelrhodopsin blue light (470 nm) sensitivities for two-color excitation in cultured neurons.
(a) Current-clamp traces of representative Chrimson-expressing neuron under pulsed vs. continuous illumination. (b) Chrimson blue light induced crosstalk voltages vs. irradiances for individual cells under pulsed illumination (5 ms, 5 Hz, n = 5 cells). (c) Photocurrent vs. blue irradiances (5 ms pulses; n = 4 cells for Chrimson, n = 8 – 10 cells for others). Vertical dotted lines indicate halfway points up the curves for ChR2 and Chronos, as fitted, analogous to “EC50”. (d) Turn-on kinetics (1 s pulse; n = 4 – 7 cells; see Supplementary Fig. 17b,c for raw traces). (e–g) Comparison between ChR2 and Chronos spike probability over three logs of blue irradiance. All pulsed illuminations used 10 pulses, 5 Hz, 5 ms pulse width. (e) Representative spiking traces at the indicated irradiances. (f) Spike probability vs. blue light irradiance, plotted for individual Chronos- or ChR2-expressing neurons and minimum irradiance threshold for 100% spiking (MIT100) as a function of GFP fluorescence. (g) Neuron spike threshold and resting potentials (n = 16 – 23 cells).

