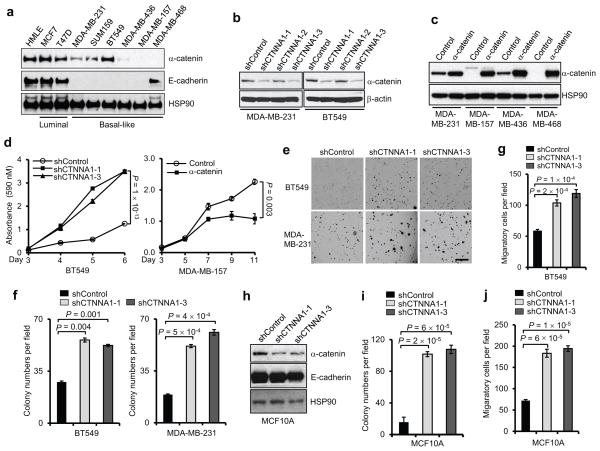
Figure 1. α-catenin inhibits proliferation and colony formation of basal-like breast cancer cells.
(a) Immunoblotting of α-catenin, E-cadherin and HSP90 in HMLE, luminal and basal-like breast cancer cell lines.
(b) Immunoblotting of α-catenin and β-actin in MDA-MB-231 and BT549 cells transduced with three independent α-catenin shRNAs.
(c) Immunoblotting of α-catenin and HSP90 in α-catenin-transduced MDA-MB-231, MDA-MB-157, MDA-MB-436 and MDA-MB-468 cells.
(d) Growth curves of BT549 cells with knockdown of α-catenin and MDA-MB-157 cells with ectopic expression of α-catenin. shControl: the pGIPZ-GFP lentiviral vector with a scrambled sequence that does not target any mRNA. Control: the pLOC lentiviral vector with an RFP open reading frame. n = 4 wells per group.
(e, f) Representative images (e) and data quantification (f) of soft agar colony formation by BT549 and MDA-MB-231 cells transduced with two independent α-catenin shRNAs. Scale bar: 100 μm. n = 3 wells per group.
(g) Transwell migration assays of BT459 cells transduced with two independent α-catenin shRNAs. n = 3 wells per group.
(h) Immunoblotting of α-catenin, E-cadherin and HSP90 in MCF10A cells transduced with two independent α-catenin shRNAs.
(i, j) Soft agar colony formation (i) and Transwell migration assays (j) of MCF10A cells transduced with two independent α-catenin shRNAs. n = 3 wells per group.
Data in (d), (f), (g), (i) and (j) are the mean of biological replicates from a representative experiment, and error bars indicate s.e.m. Statistical significance was determined by a two-tailed, unpaired Student’s t-test. The experiments were repeated three times. The source data can be found in Supplementary Table 4. Uncropped images of blots are shown in Supplementary Fig. 7.

