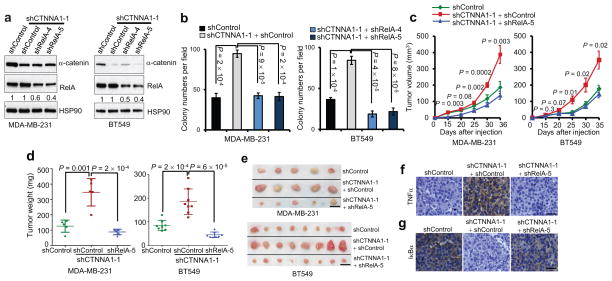
Figure 5. Loss of α-catenin promotes tumor growth in basal-like breast cancer cells by activating NF-κB signaling.
(a) Immunoblotting of α-catenin, RelA and HSP90 in MDA-MB-231 and BT549 cells transduced with α-catenin shRNA alone or in combination with RelA shRNA.
(b) Soft agar colony formation by MDA-MB-231 and BT549 cells transduced with α-catenin shRNA alone or in combination with RelA shRNA. n = 4 wells per group.
(c) Tumor growth by subcutaneously implanted MDA-MB-231 (3 × 10⁶ cells injected) or BT549 (4 × 10⁶ cells injected) cells infected with α-catenin shRNA alone or in combination with RelA shRNA. P values correspond to comparisons between α-catenin shRNA alone and α-catenin shRNA in combination with RelA shRNA.
(d, e) Tumor weight (d) and tumor images (e) 5 weeks after mice were injected subcutaneously with MDA-MB-231 or BT549 cells transduced with α-catenin shRNA alone or in combination with RelA shRNA. Scale bar: 1 cm. n = 5 (for MDA-MB-231 cells) or 8 (for BT549 cells) mice per group in (c) and (d).
(f, g) TNFα (f) and human-specific IκBα (g) immunohistochemical staining of subcutaneous tumors formed by MDA-MB-231 cells transduced with α-catenin shRNA alone or in combination with RelA shRNA, at 5 weeks after implantation. Scale bar: 50 μm.
Data in (b) – (d) are the mean of biological replicates from a representative experiment, and error bars indicate s.e.m. Statistical significance was determined by a two-tailed, unpaired Student’s t-test. The experiments were repeated three times. The source data can be found in Supplementary Table 4. Uncropped images of blots are shown in Supplementary Fig. 7.

