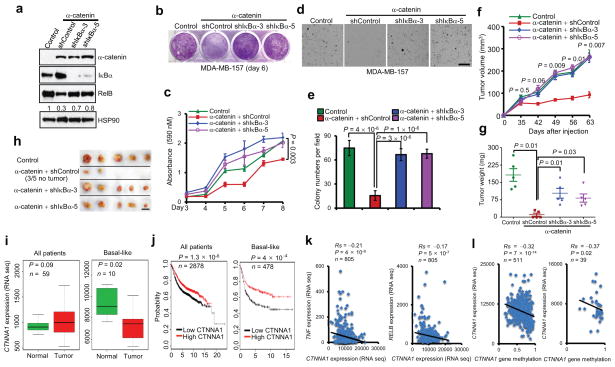
Figure 6. α-catenin inhibits tumorigenesis and is downregulated in human basal-like breast cancer.
(a) Immunoblotting of α-catenin, IκBα, RelB and HSP90 in MDA-MB-157 cells transduced with α-catenin alone or in combination with IκBα shRNA.
(b, c) Images (b) and quantification (c) of growth curves of cells described in (a). n = 3 wells per group.
(d, e) Images (d) and quantification (e) of soft agar colony formation by cells described in (a). Scale bar: 100 μm. n = 5 wells per group.
(f) Tumor growth by 3 × 10⁶ subcutaneously injected cells described in (a). P values correspond to comparisons between α-catenin alone and α-catenin in combination with IκBα shRNA (shIκBα-3) in (c) and (f).
(g, h) Tumor weight (g) and tumor images (h) of mice described in (f). Scale bar: 1cm. n = 5 mice per group in (f) and (g).
(i) Box plots comparing CTNNA1 expression in normal breast tissues and in total (n = 59) and basal-like (n = 10) breast tumors. Statistical significance was determined by the Wilcoxon test. The boxes show the median and the interquartile range. The whiskers show the minimum and maximum.
(j) Kaplan-Meier curves of relapse-free survival times of total breast cancer patients (n = 2878) and patients with basal-like breast cancer (n = 478), stratified by CTNNA1 expression levels. Data were obtained from http://kmplot.com/analysis/34. Statistical significance was determined by the log-rank test.
(k) Scatterplots showing the inverse correlation of CTNNA1 with TNF (left panel) or RELB (right panel) expression in human breast tumors (n = 805).
(l) Scatterplots showing the inverse correlation between methylation of the CTNNA1 gene and CTNNA1 expression in total (left panel, n = 511) and basal-like (right panel, n = 39) breast tumors. Statistical significance in (k) and (l) was determined by Spearman rank correlation test. Rs = Spearman rank correlation coefficient.
Data in (c) and (e) – (g) are the mean of biological replicates from a representative experiment, and error bars indicate s.e.m. Statistical significance was determined by a two-tailed, unpaired Student’s t-test. The experiments were repeated three times. The source data can be found in Supplementary Table 4. Uncropped images of blots are shown in Supplementary Fig. 7.

