Figure 4.

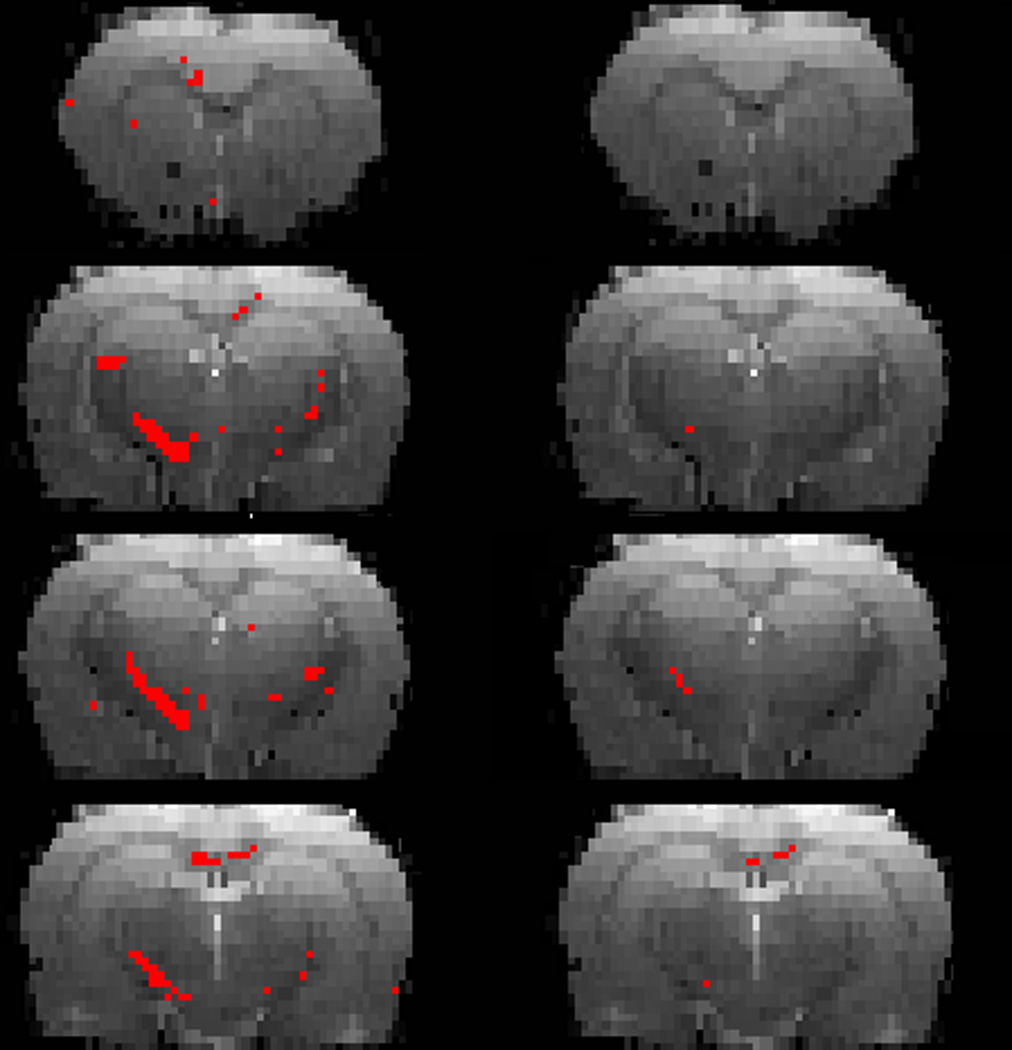
The t-maps (shown in red) with significantly different FA values between controls and cocaine treated animals superimposed on the RARE images, without (left) and with (right) FDR correction for multiple comparison.

The t-maps (shown in red) with significantly different FA values between controls and cocaine treated animals superimposed on the RARE images, without (left) and with (right) FDR correction for multiple comparison.