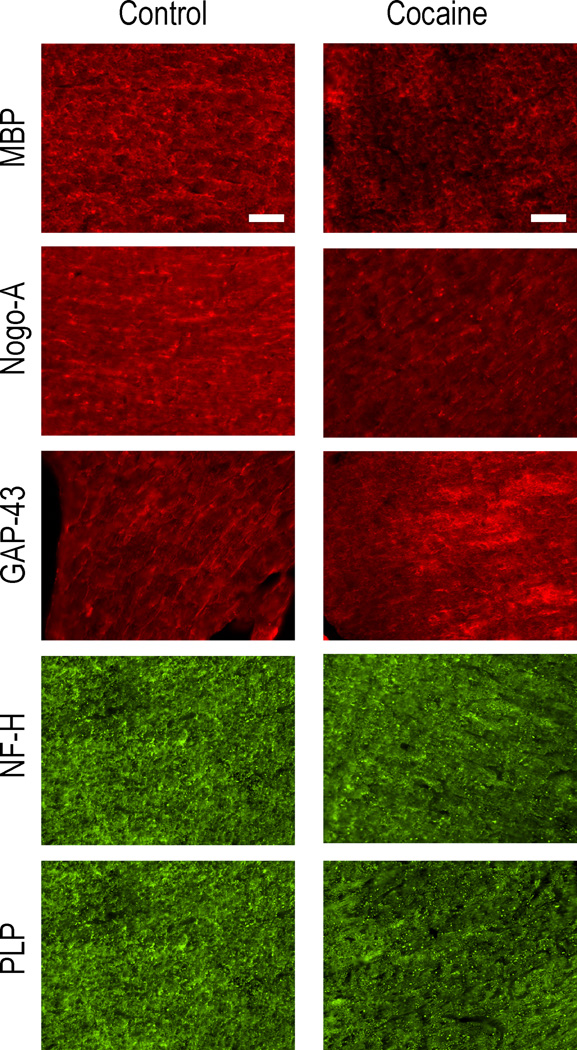
Figure 7.
Representative images of brain sections of the fimbria from control and cocaine exposed brains. The images were obtained to demonstrate the labeling patterns of [panels A and B] myelin basic protein (MBP), [C and D] Nogo-A, [E and F] GAP-43, [G and H] neurofilament – heavy isoform (NF-H), [J and K] proteolipid protein (PLP), and [L and M] aquaporin-4 (AQP-4). scc = splenium. Scale bars = 100 µm.

