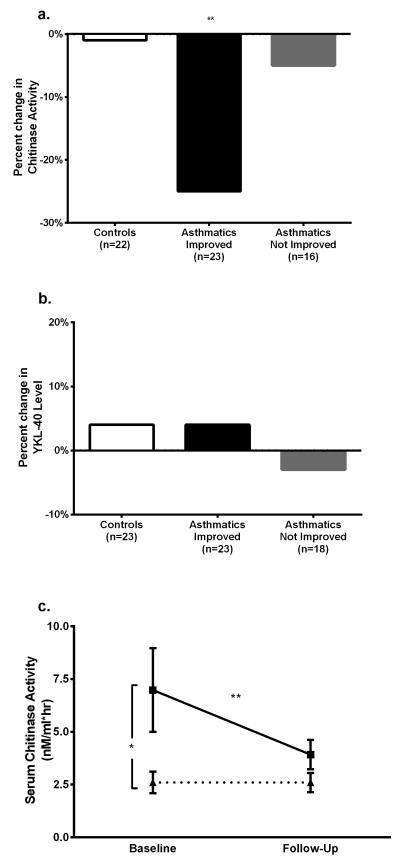
Figure 2.
Change in Chitinase Activity and YKL-40 Level over Study Period
a. Percent change in Chitinase Activity. 22 controls, 22 asthmatics with improvement, and 16 asthmatics without improvement. Change in chitinase activity was significant for asthmatics with improvement, but not others (Wilcoxon Signed Rank Test).
b. Percent change in YKL-40 level. 23 controls, 22 asthmatics with improvement, and 18 asthmatics without improvement. Change in chitinase activity was not significant for any group (Wilcoxon Signed Rank Test).
c. Change in Chitinase Activity in Poorly-Controlled Asthmatics. Solid line with squares represents 19 poorly-controlled asthmatics who improved, and dotted line with triangles represents 3 poorly-controlled asthmatics who did not improve control. Baseline chitinase activity was significantly higher in children that improved (Mann-Whitney U Test), and chitinase activity significantly decreased in children who did not (Wilcoxon Signed Rank Test). Chitinase activity did not significantly change in children who did not improve.
* p < 0.05, ** p < 0.01. Poorly-controlled defined as baseline Asthma Control Test (ACT) Score < 20, rescue SABA usage > 2 times/week, Emergency Room / Urgent Care Visits ≥ 2/year, or Oral Corticosteroid (OCS) courses ≥ 2/year.

