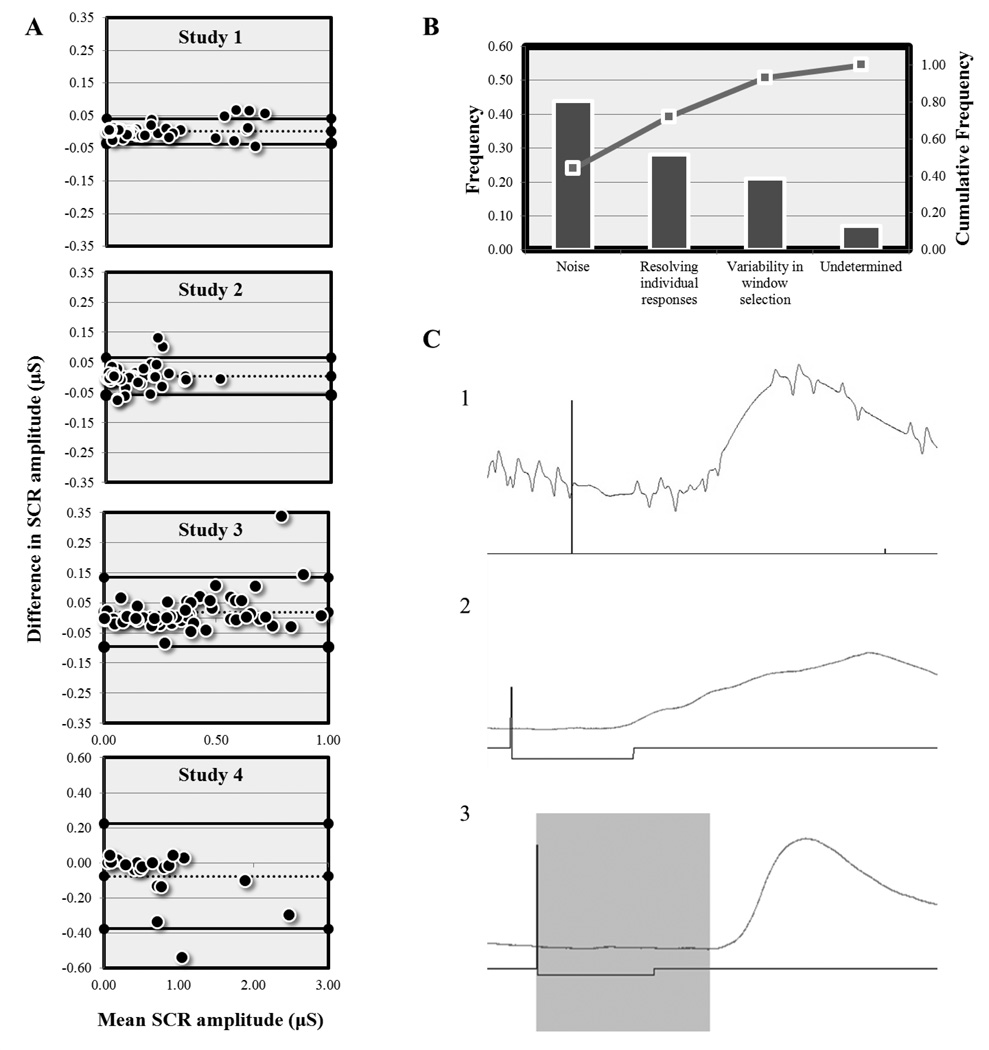
Figure 2. Sources of variance between Autonomate and manual scoring methods.
(A) Bland-Altman plots indicating excellent general agreement between methods, with a few outliers. (B) Pareto chart showing root causes of outliers. Bar plots indicate relative frequency (out of all outliers) while the scatterplot indicates cumulative frequency. (C) Exemplar trials in which (1) noise in data, (2) resolving individual responses, and (3) variability in window selection lead to discrepancies in SCR amplitude measures between the two methods.

