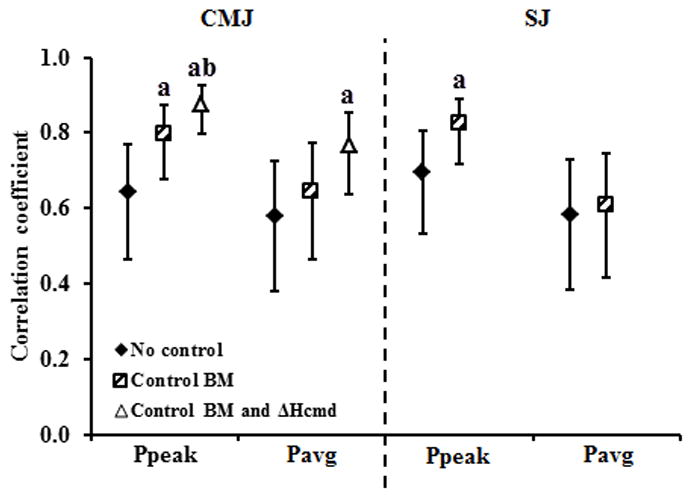
Figure 1.

Pearson’s correlations coefficients (No control) and the partial correlations controlled for body mass (Control BM) and for both body mass and countermovement depth (Control BM and DEPTH) observed between the jump height and the peak, as well as the average power output (a - significantly above No control; b - significantly above Control BM). All correlation coefficients are shown with the corresponding 95% confidence intervals.
