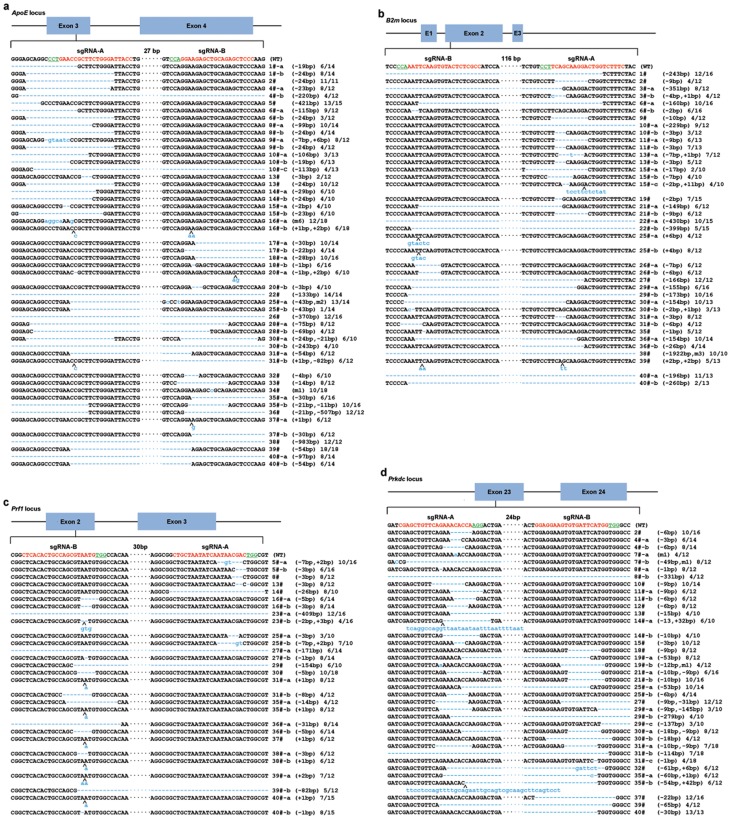
Figure 2. Schematic diagrams of sgRNAs and DNA sequences of targeting genomic loci.
PCR amplicon of the targeted fragment in the ApoE, B2m, Prf1, and Prkdc in all founder rats (#1∼40) were sequenced. The PAM sequence is underlined and highlighted in green; the targeting site are red; the mutations are blue, lower case; insertions (+), deletions (−) or mutant (m) are shown to the right of each allele. N/N indicates positive colonies out of total sequenced. (a) ApoE locus. (b) B2m locus. (c) Prf1 locus. (d) Prkdc locus.

