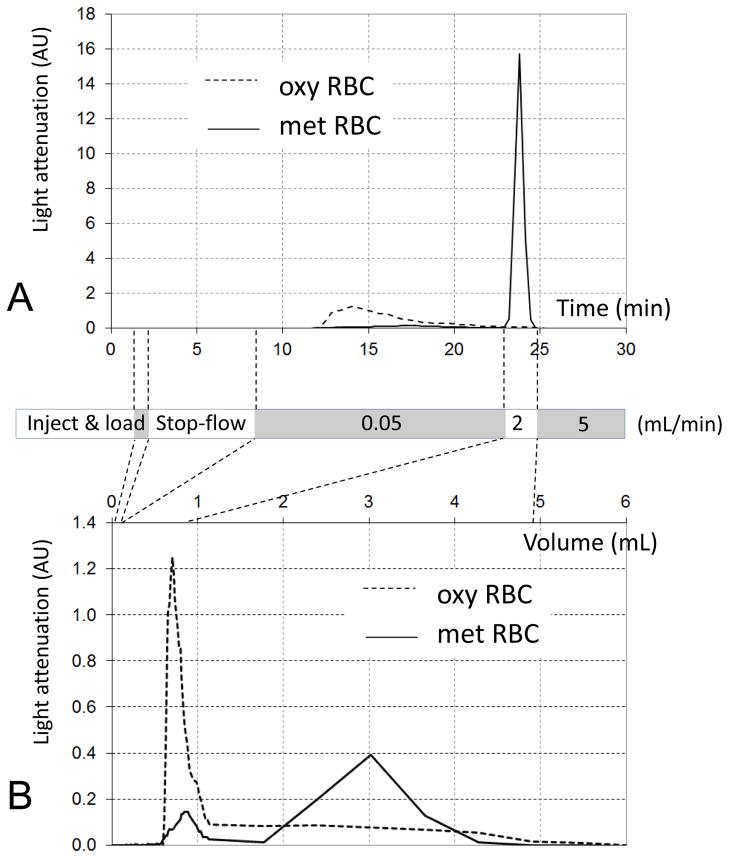
Fig 4.
Fractograms of pure oxy RBC and pure met RBC preparations combined into a single plot. A Measured as a function of the elution time. B Recalculated as a function of the elution volume. The grey & white box diagram indicates phases of the mobile phase flow. The data were obtained using a single-syringe magnetic FFF setup.

