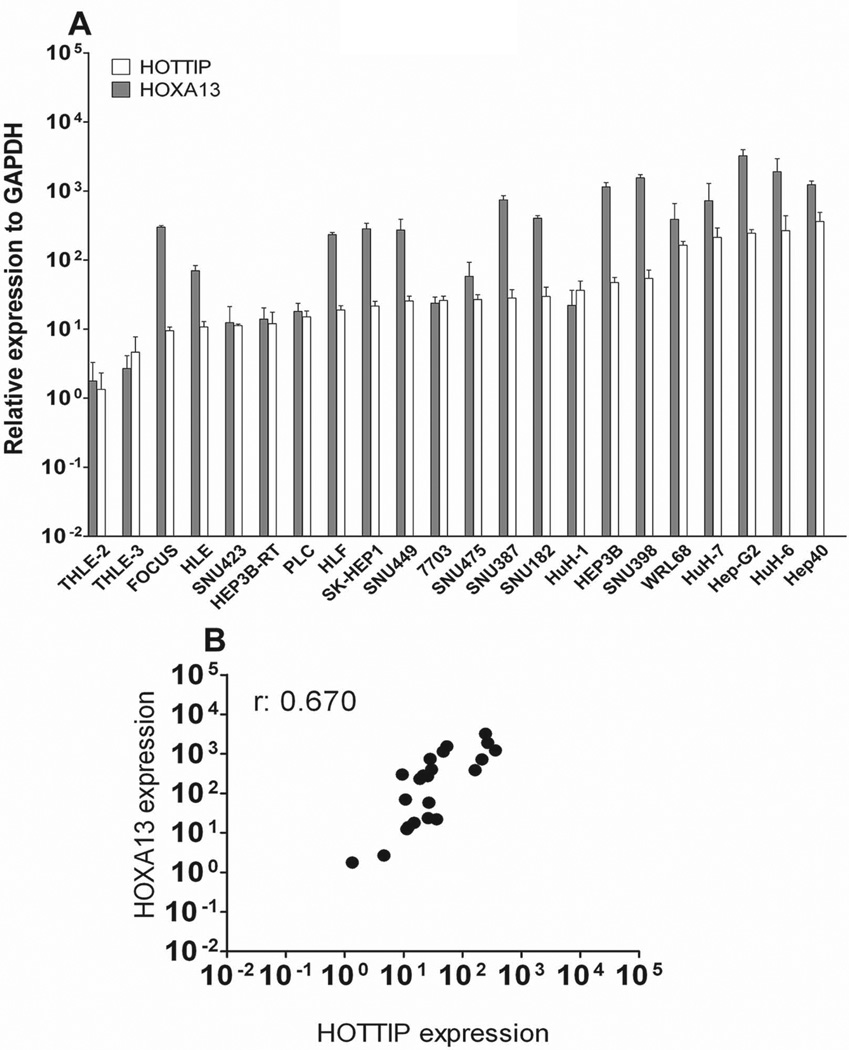
Fig. 3.
HOTTIP and HOXA13 expression levels in liver-cancer derived cell lines. (A) qRT-PCR data reveal a broad spectrum of expression among the 20 tested cell lines. Non-tumoral liver cell lines THLE-2 and THLE-3 display the lowest expression of both HOTTIP and HOXA13. Data are presented as mean ± SEM. (B) Correlation scatter plot (Spearman test) of HOTTIP and HOXA13 expression in liver-cancer derived cell lines. GAPDH has been used as reference gene.

