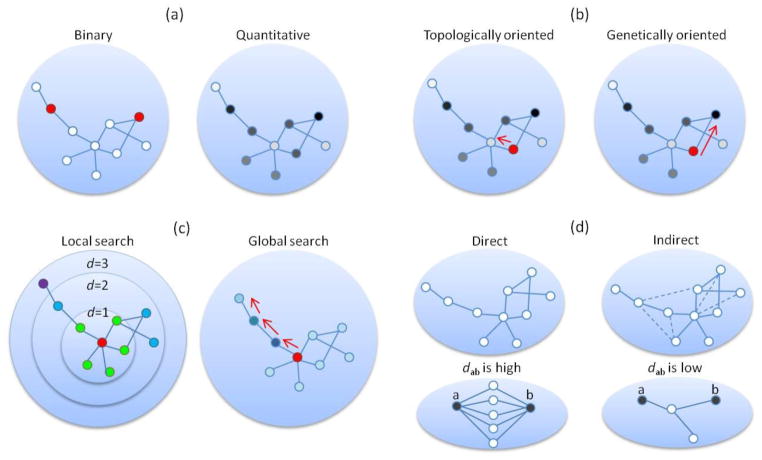
Figure 4.
Algorithms in network-assisted analysis of GWAS data. Nodes represent genes. Red nodes denote seed genes. (a) Two representations of gene association signals: binary (left) versus quantitative (right). Gene-based association signals are indicated by color and darkness: red/white for seed/non-seed genes (left) and darkness level proportional to the association strength (right). (b) Search methods guided by topological characteristics (left) or genetic signals (right). Starting from a seed gene (in red), the former method searches for candidate genes with significant topological characteristics (e.g., genes with high degree), while the latter method searches for candidate genes with strong association signals (nodes in dark color). (c) Search that is restricted by local paths or global paths. Nodes are categorized according to their distance (d, defined by shortest path) from the seed gene (in red), e.g., nodes with d=1 (in green), d=2 (in blue), and d=3 (in purple). In local searches, only nodes that are located within a pre-defined distance (e.g., d≤2) from the seed genes are considered. In global searches, the search space is not defined by d but could theoretically access every node in the network. (d) Search methods in the space of direct and indirect (dash lines) interactions. Suppose dab represents the closeness between two nodes, a and b, in the network. When many paths exist between the nodes, these nodes are considered to be close to each other in network space, and their closeness (dab) is high. On the other hand, if there are few paths (in the bottom right panel, only one path exists between nodes a and b), the dab of these nodes is low.

