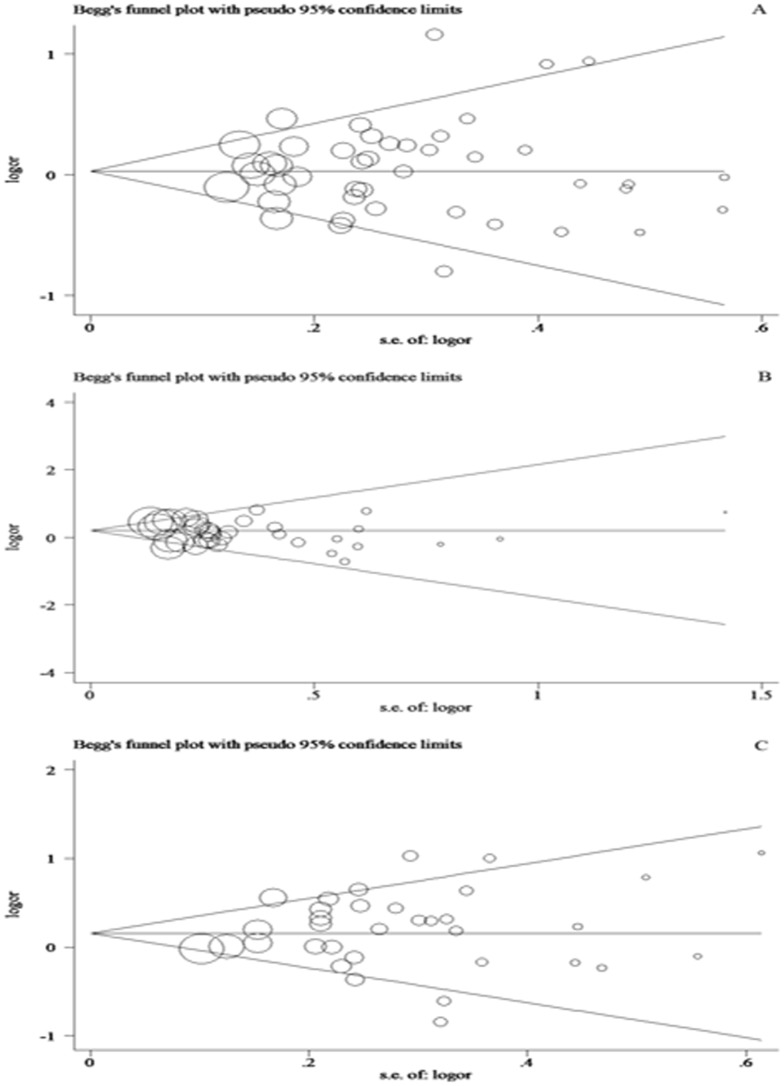
Figure 4. Begg's funnel plot of Egger's test for publication bias for three polymorphisms.
Each circle represents as an independent study for the indicated association. Log[OR], natural logarithm of OR. Horizontal lines mean effect size. A: Begg's funnel plot of publication bias test for Fas -670A>G polymorphism. B: Begg's funnel plot of publication bias test for Fas -1377G>A polymorphism. C: Begg's funnel plot of publication bias test for FasL -844C>T polymorphism.

