Figure 2.
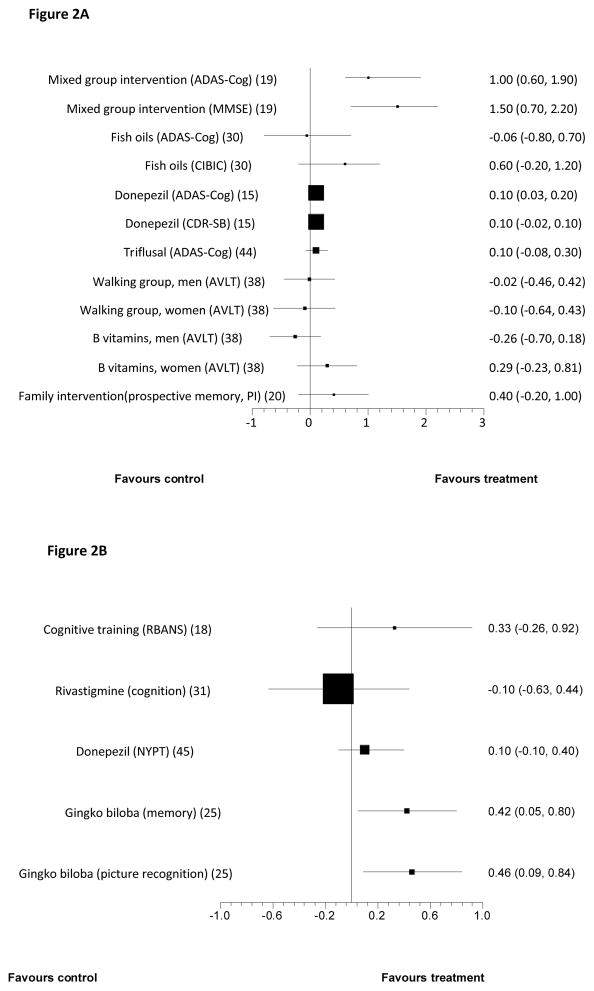
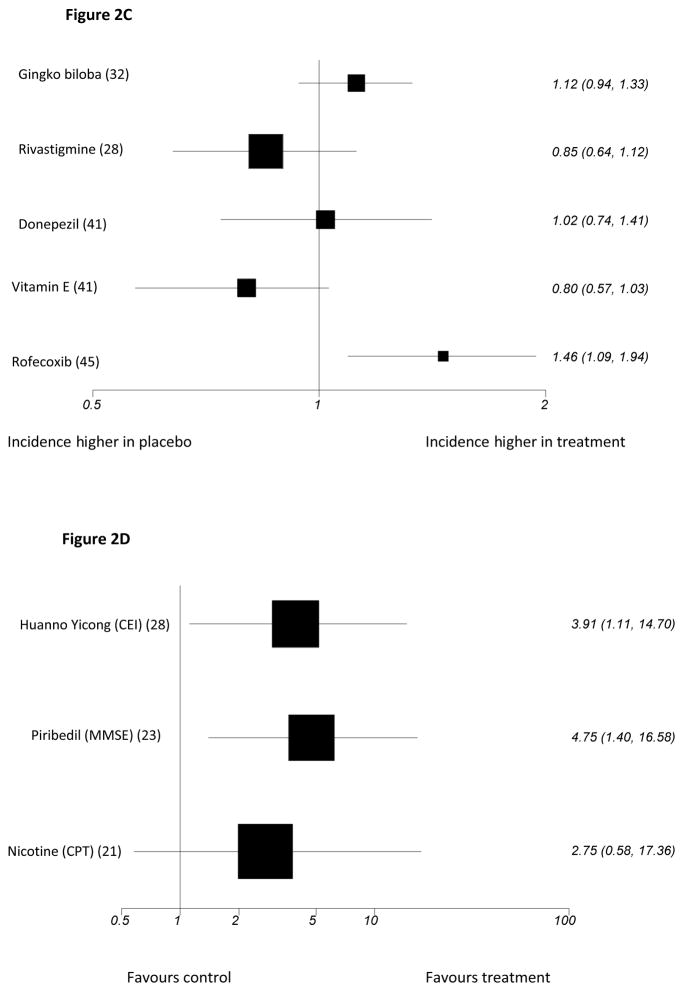
Forest plots showing between group comparisons for standardised primary outcomes post-intervention for all studies citing one or two primary outcomes(see text for study duration)1
Figure 2A: Studies with outcomes expressed as Standardised Mean Difference (with 95% confidence intervals)
Figure 2B: Studies with outcomes expressed as Standardised Mean Change from baseline (with 95% confidence intervals)
Figure 2C: Studies reporting Hazard Ratios (95% confidence intervals) for incident dementia or Alzheimer’s disease (log scale)
Figure 2D: Studies for which outcomes expressed as odds ratio for response (95% Confidence intervals) (log scale)
See Table 1 for key to abbreviations


