
Fig. 2.
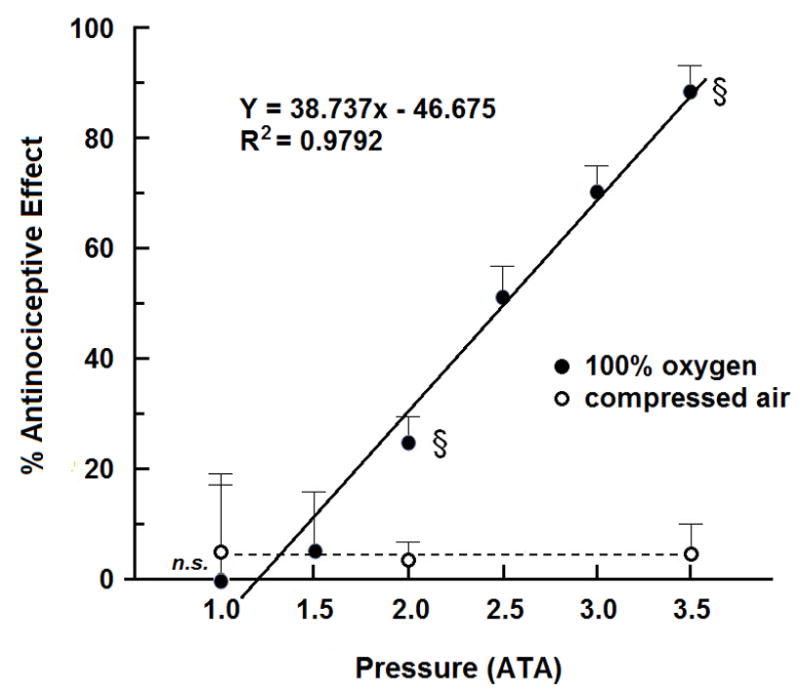
The influence of increasing pressure on oxygen-induced antinociceptive effect in mice. Each symbol (solid square for compressed air and solid diamond for 100% oxygen) represents the mean antinociceptive response of 8 mice at each pressure. The solid line shows the linear relationship between percent antinociceptive effect to 100% O2 and pressure; the dotted line shows that pressure alone fails to evoke an antinociceptive effect in mice exposed to compressed air. Significance of difference: §, P < 0.05, n.s., not significant, compared to compressed air at the same pressure (unpaired t-test).