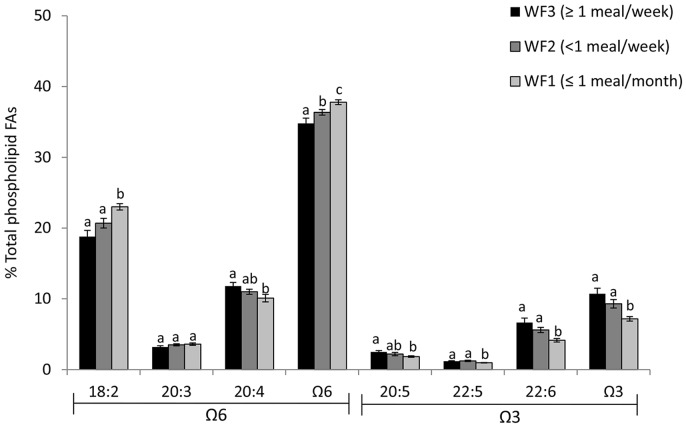
Figure 5. Mean (± SE) contribution of individual fatty acids to total phospholipids in blood (%) for participants from Wapekeka and Kasabonika First Nations consuming three levels of wild food consumption.
WF1 (n = 28; ≤1 meal per month), WF2 (n = 22; <1 meal per week), and WF3 (n = 21; ≥1 meal per week) Letters indicate significant differences in groups (p<0.05).

