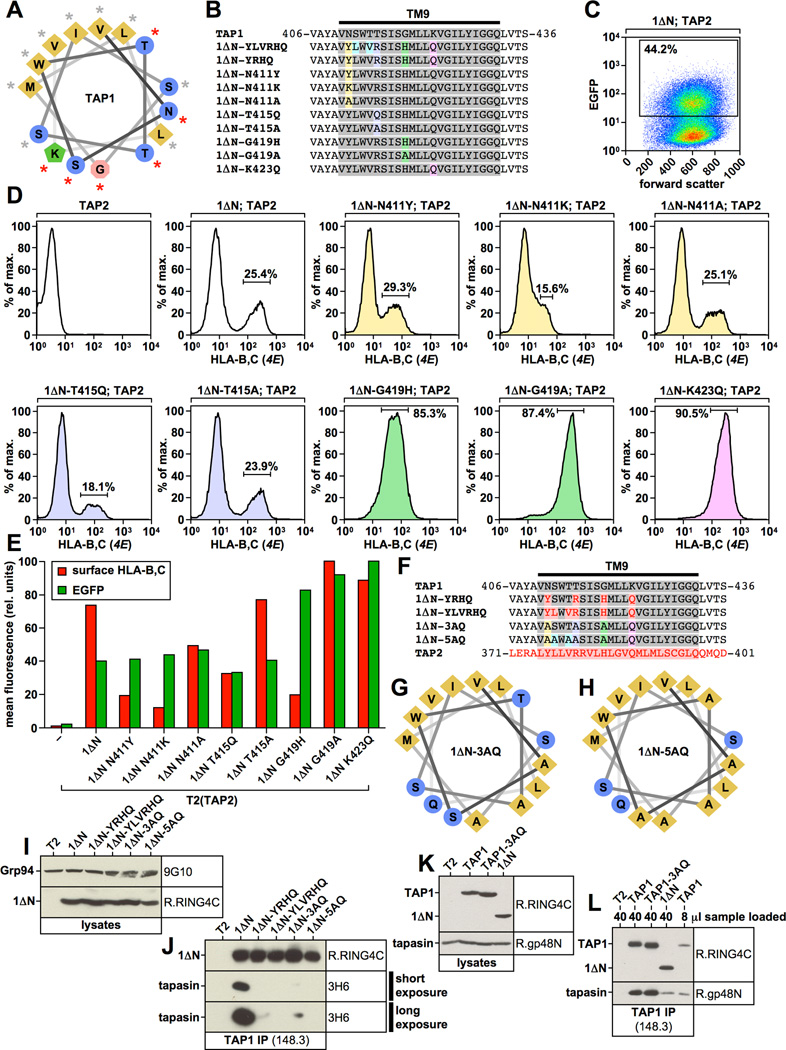
Figure 7. Functional analysis of 1ΔN point mutants.
A) Helical wheel projection of the first two thirds of the TAP1 transmembrane segment TM9. Residues whose mutation result in reduced tapasin binding are indicated with a red asterisk. B) Alignment of the TAP1-TM9 and selected point mutants. TAP1 sequences are shown in grey. Point mutations are highlighted in color. C) Flow cytometry analysis showing EGFP expression versus forward scatter for the T2 transfectant co-expressing 1ΔN and TAP2. The EGFP-positive population is shown in the gate. D, E) Flow cytometry analysis of surface-HLA-B,C expression using antibody 4E in the indicated T2 transfectants. Results were first gated on living cells (propidium iodide-negative), then on EGFP-positive cells using the gate shown in Fig. 7C. Cells expressing TAP2 alone (first histogram in upper row) were not gated on EGFP. The color code of the histograms corresponds to the color code used in Fig. 7B. The flow cytometry results are shown as a bar diagram in Fig. 7E (red bars, surface-HLA-B,C levels; green bars, EGFP fluorescence). F) Alignment of the TAP1-TM9, the corresponding TAP2 sequence, and selected mutants. TAP1 sequences are shown in grey. TAP2 sequences are shown in red. The color code for mutations in constructs 1ΔN-3AQ and 1ΔN-5AQ is adapted from Fig. 7B/D. G, H) Helical wheel projection of the first two thirds of the transmembrane segment TM9 in mutants 1ΔN-3AQ and 1ΔN-5AQ. I, K) Western blot analysis showing digitonin lysates from stable T2 transfectants using antibodies recognizing TAP1 (R.RING4C), Grp94 (9G10), or tapasin (R.gp48N). J, L) TAP1 was immunoprecipitated with antibody 148.3 from digitonin lysates of untransfected T2 cells or the indicated stable T2 transfectants. Isolated proteins were analyzed by Western blotting using antibodies against TAP1 (R.RING4C) and tapasin (R.gp48N or 3H6).

