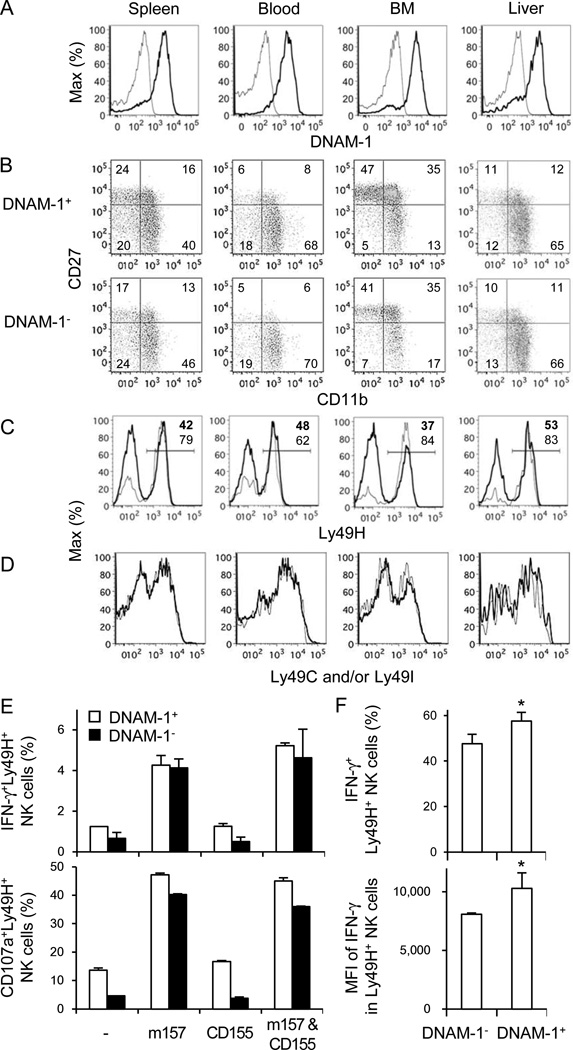
Figure 1. Phenotype of DNAM-1+ and DNAM-1− NK cells.
(A) Expression of DNAM-1 on NK cells in the spleen, blood, BM, and liver, gating on TCRβ−NK1.1+ lymphocytes. Thin and bold lines represent staining with control Ig and anti-DNAM-1 mAb. (B) Developmental stages of DNAM-1+ and DNAM-1− NK cells as determined by co-staining with CD27 and CD11b, gating on TCRβ−NK1.1+ lymphocytes. (C) Ly49H expression on DNAM-1+ (thick lines) and DNAM-1− (thin lines) NK cells, gated on TCRβ−NK1.1+ lymphocytes. Percentages of Ly49H+ NK cells in DNAM-1+ (bold numbers) and DNAM-1− NK (thin numbers) cells are shown. (D) Expression of Ly49C and/or Ly49I on DNAM-1+ (thick lines) and DNAM-1− (thin lines) NK cells. Data are representative of 2–4 experiments. (E) IFN-γ production and degranulation of Ly49H+DNAM-1+ and Ly49H+DNAM-1− NK cells after co-culture with RMA cells expressing m157, CD155, or m157 and CD155. Data are representative of 2 independent experiments (n = 3–6 per experiment). (F) Twenty-five million WT splenocytes were transferred into DAP12-deficient mice and infected with 1 × 10⁵ pfu MCMV. IFN-γ production by Ly49H+ NK cells was analyzed by intracellular staining on day 1.5 pi. Percentages of IFN-γ+Ly49H+ NK cells and mean fluorescent intensity (MFI) of IFN-γ of Ly49H+ NK cells within the DNAM-1+ and DNAM-1− Ly49H+ NK cell subsets are shown. Data are representative of 3 experiments (n = 3–4 mice per experiment). Error bars show s.e.m. *p <0.05.

