
Figure 1.
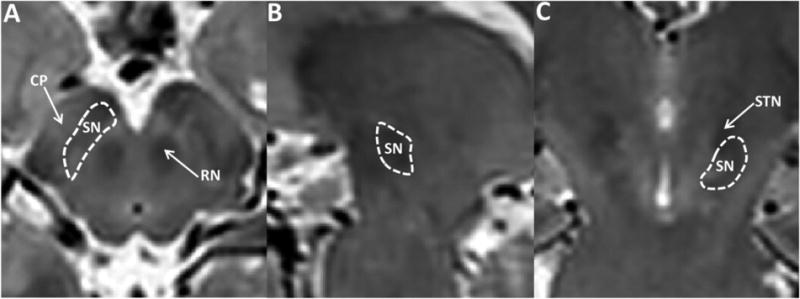
Illustration of region of interest (ROI) definition of the substantia nigra. A, B, and C represent axial (A), sagittal (B) and coronal (C) views of the midbrain in T2-weighted images. The yellow arrows in A and C indicate the substantia nigra (SN), red nucleus (RN), cerebral peduncle (CP), and subthalamic nucleus (STN).