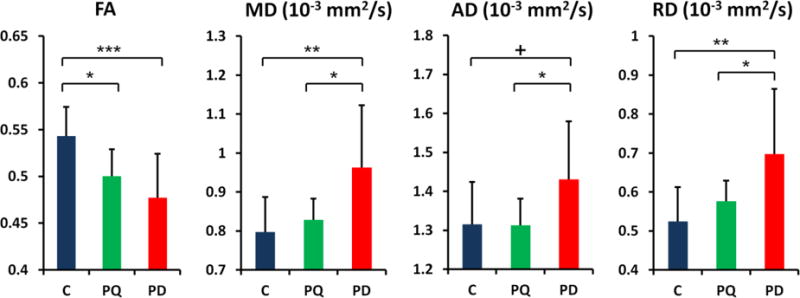
Figure 2.

Comparison of DTI values in the substantia nigra for Control (C), pesticide-exposed, and Parkinson's disease (PD) subjects. Error bars represent the standard deviation. FA: Fractional anisotropy; MD: mean diffusivity; AD: axial diffusivity; RD: radial diffusivity Significant differences between groups are represented as: +: p<0.1; *: p<0.05; **: p<0.01;***: p<0.001.
