
Figure 1. Trend in absolute inequalities in obesity for urban and rural Mexican women 1988–2012.
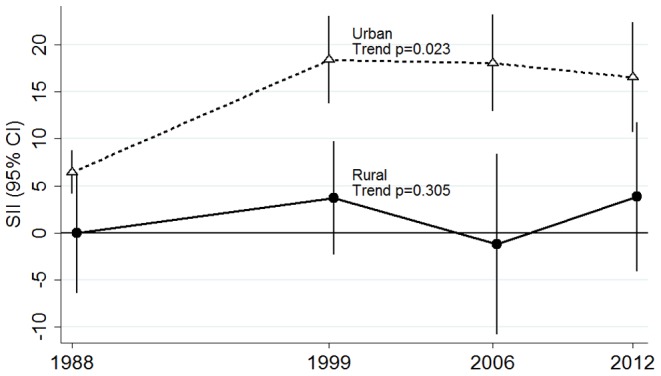
Each point represents the slope index of inequality (SII) for the particular year. Error bars represent the 95% confidence intervals of the SII. Plotted estimates are adjusted for age.