
Figure 1.
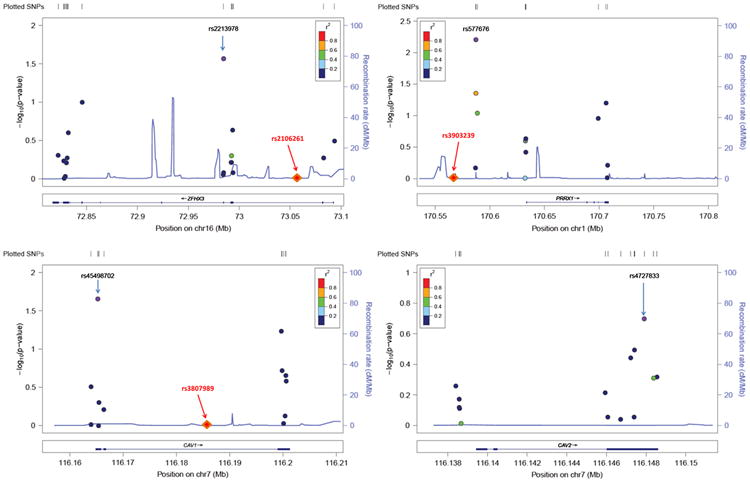
Regional association plots of atrial fibrillation (AF)–related genes. Common variants identified by sequencing in each of the 4 AF-related genes are plotted according to their chromosomal position on the x-axis (NCBI Build 37, 2009). The y-axis provided the −log10 P value of each variant's association with AF. Variants are clustered within the exons of these genes and colored on the basis of the linkage disequilibrium (r2) to the most significant single-nucleotide polymorphism (SNP; purple point) in each gene region. The diamond symbols indicate the location of the original genome-wide association study (GWAS) signal (the most significant SNP) relative to the sequence regions. Of note, the GWAS SNPs were located in introns or intergenic regions and thus not directly sequenced here. Also, CAV1 and CAV2 genes are adjacent, which is why a GWAS SNP is present only in the CAV1 plot.