
Figure 2.
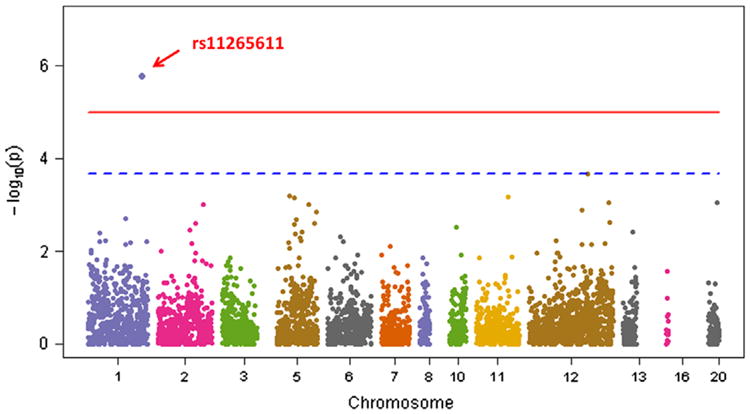
Manhattan plot of common variants. All common single-nucleotide polymorphisms (SNPs; n = 4800) were analyzed by using unweighted models. The −log10 P value of each SNP is plotted according to its chromosomal position. The red horizontal line indicates the Bonferroni corrected threshold of significance at P = 1.0 × 10⁻⁵, whereas the blue horizontal line indicates the 1 false-positive threshold at P = 1/4800 = 2.1 × 10⁻⁴.