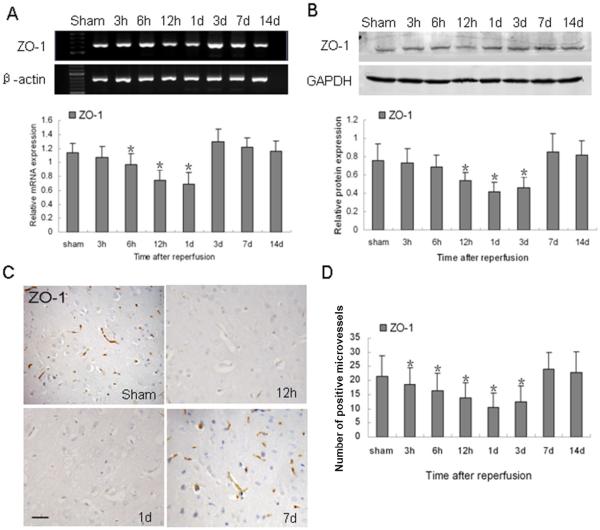
Fig. 3.
Changes in ZO-1 expression after ischemia and reperfusion. (A) RT-PCR of ZO-1 mRNA at the indicated time points after reperfusion. β-actin was used as a loading control. (B) Western blot of ZO-1 protein after reperfusion. Glyceraldehyde 3-phosphate dehydrogenase (GAPDH) was used as a loading control. (C) ZO-1 immunoreactivity was observed in vascular-like structures, especially in the adjacent vessels. ZO-1 was strongly expressed in the brains of sham-operated rats, but it was weakly expressed at 12 h and 1 day after ischemic reperfusion. Scale bar = 50 μm. (D) Quantification analysis of ZO-1-positive microvessels per 40x field at the indicated time points after ischemic reperfusion. Data in A, B, and D are presented as means ± S.D. and were analyzed by one-way ANOVA followed by the Bonferroni post hoc test. n = 7 rats per group; *p < 0.05 compared with the sham group.

