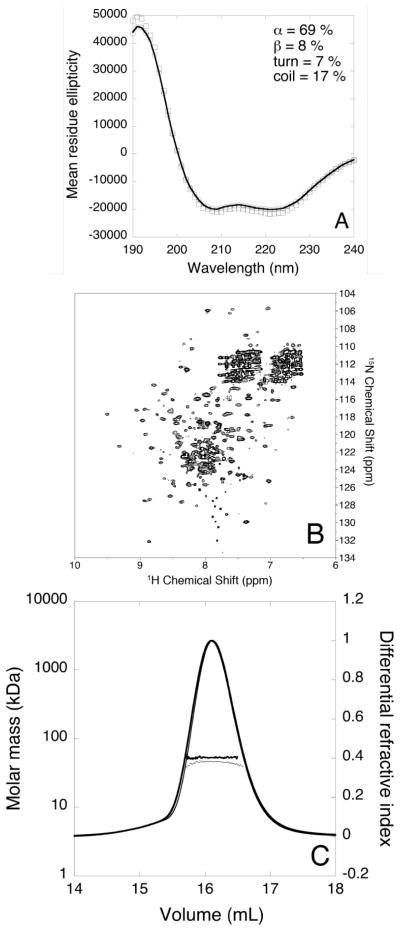
Figure 3.
(A) Far-UV CD spectrum of HpUreF in 20 mM phosphate buffer in the absence (hollow circles) and in the presence of two equivalents of Ni2+ (hollow squares) per protein dimer. The best fit calculated for apo-HpUreF is represented as a solid line. Mean residue ellipticity units are degrees cm2 dm−1 residue−1; (B) Representative 1H-15N TROSY-HSQC spectrum of apo-HpUreF acquired at 900 MHz and 298 K; (C) Plot of the molar mass distribution of HpUreF in the absence (thick dots and line) and in the presence (thin dots and line) of two equivalents of Ni2+ per protein dimer. The solid lines indicate the Superdex-75 elution profiles monitored by the refractive index detector, while the dots are the weight-averaged molecular masses for each slice, measured every second.

