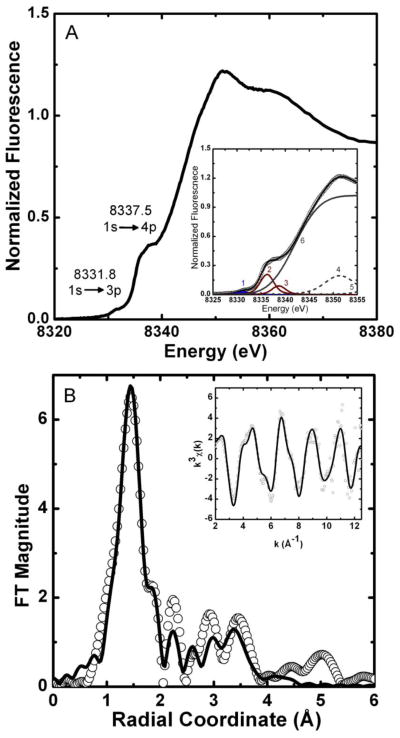
Figure 4.
HpUreF Ni K-edge XAS. (A) XANES spectrum; the inset reports the data (circles) vs. the fitted sum (line) from the individual XANES spectrum pre-edge features (peaks 1 to 5; see SI-1). (B) Fourier-transformed EXAFS spectrum (circles) and best fit (line), shown without phase correction (FT window = 2–12.5 Å−1). Inset: k3-weighted unfiltered EXAFS spectrum and best fit. The fit shown is for the (N/O)1(Namide)1(NHis)1(OCO2)2 model from Table 1.

