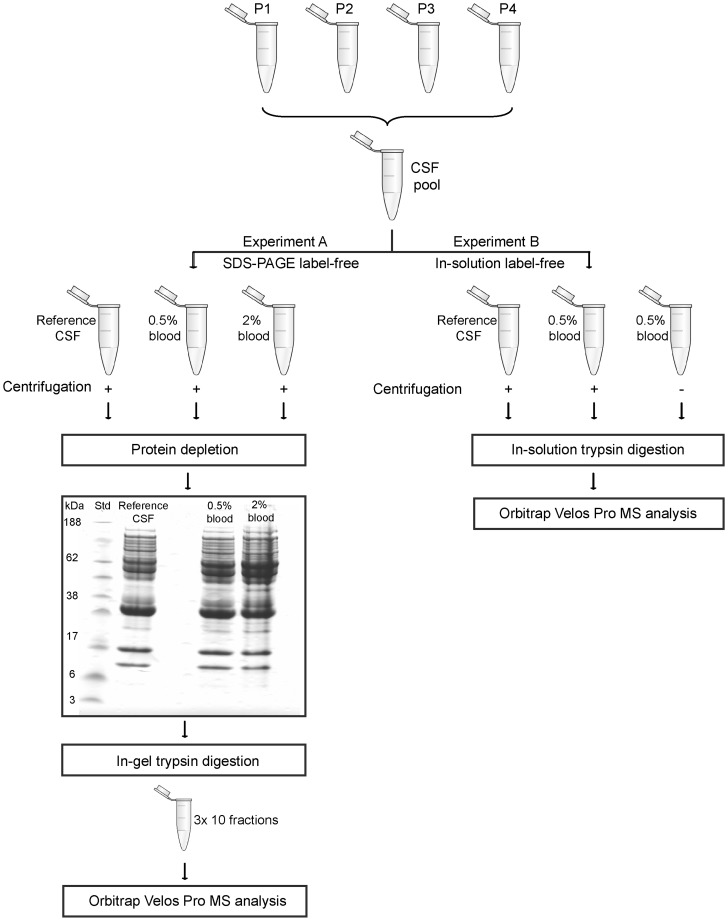
Figure 2. Flow chart of the blood contamination studies.
Cerebrospinal fluid (CSF) from four patients (P1-P4) were pooled and divided into aliquots which were spiked with different amounts of blood. In experiment A, a reference sample was compared to CSF spiked to achieve 0.5% and 2% blood. The CSF samples were centrifuged, protein depleted, and separated by SDS-PAGE into ten fractions per lane. In experiment B, we examined the effect of centrifugation. A reference sample was compared to two CSF samples spiked to achieve 0.5% blood, where one of the blood contaminated samples was not centrifuged. The samples were trypsin digested in-solution. All samples were analyzed on an OrbiTrap Velos Pro.

