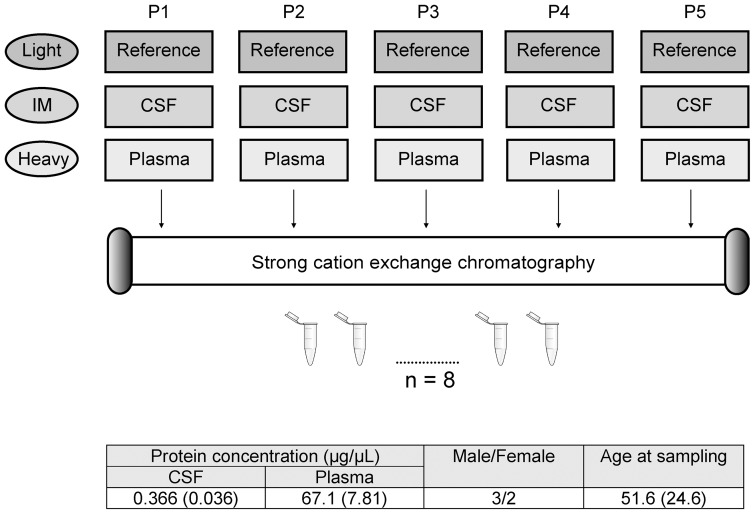
Figure 4. Flow chart of the plasma/CSF study.
We compared the cerebrospinal fluid (CSF) and plasma protein ratio of five patients (P1-P5) using dimethyl labeling. The reference sample was a mix of equal total amount of CSF and plasma, and was labeled by light reagents. The five CSF samples were labeled by intermediate (IM) reagents, and the plasma samples were labeled by the heavy reagents. The light, IM and heavy labeled samples were combined and fractionated into eight fractions by strong cation exchange chromatography and analyzed on an Orbitrap Velos Pro. The average (and standard deviation) protein concentration of CSF and plasma, age at sampling and ratio male/female of the five patients are presented in the figure.

