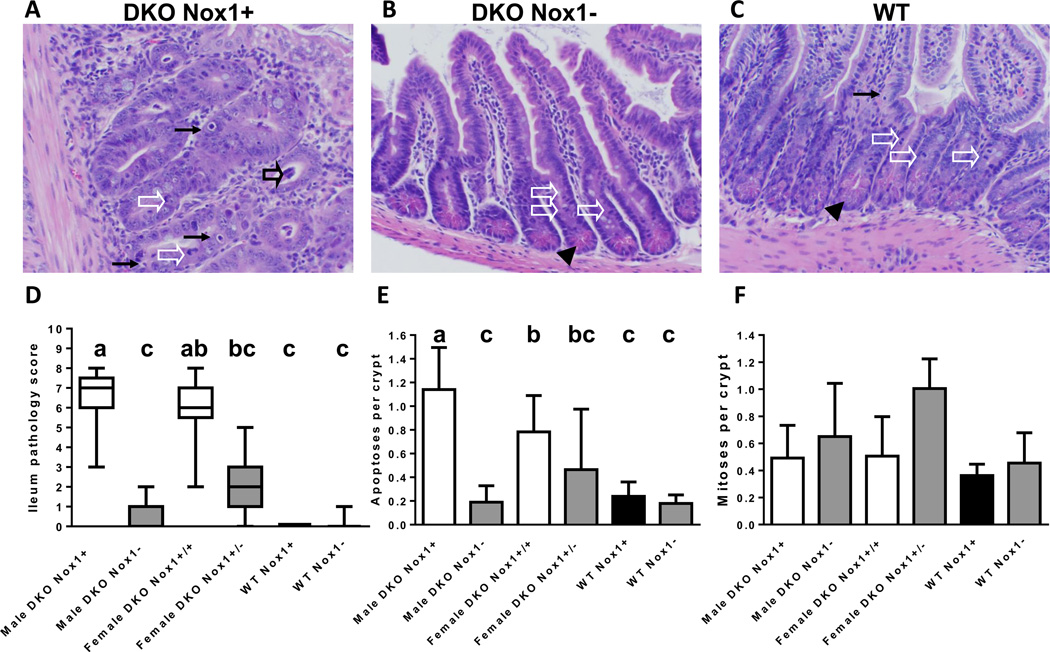
Figure 4.
Ileal histology, pathology scores and number of apoptotic and mitotic figures per crypt determined in 50-day-old mice. Panel A-C are H&E-stained ileal sections from a representative male DKO (A), TKO (B) and WT (C) mice. The black arrows point to apoptotic figures, white arrow heads point to mitotic figures, filled black arrow heads point to Paneth cells and the open black arrow points to exfoliation. The B6 DKO ileum has enlarged crypts, lacks Paneth cells and have multiple apoptotic figures, while B6 TKO and WT ileum is unremarkable. Panel D. A box-and-whisker plot of ileal pathology score showing the median and interquantile range. The scores were determined from 21 male DKO, 22 male TKO, 13 female DKO, 12 female het-TKO (GPx1/2-DKO Nox1+/−), 4 WT and 7 Nox1-KO mice. The groups with different letters have different medians, where a>b>c. When the groups share the same letter are not different; i.e. ab is is not different from a or b groups and bc is not different from b or c groups. Panel E. A bar graph of the mean number of apoptotic figures per crypt in mouse ileum. The number of mice in each group is 18 male DKO, 16 male TKO, 9 female DKO, 5 female het-TKO, 4 WT and 7 Nox1-KO mice. The groups with different letters have different mean, where a>b>c. Panel F. A bar graph of average number of mitotic figures per crypt in mouse ileum. The number of mice in each group is 17 male DKO, 17 male TKO, 10 female DKO, 4 female het-TKO, 4 WT and 7 Nox1-KO mice. The error bars in E and F are one SD.

