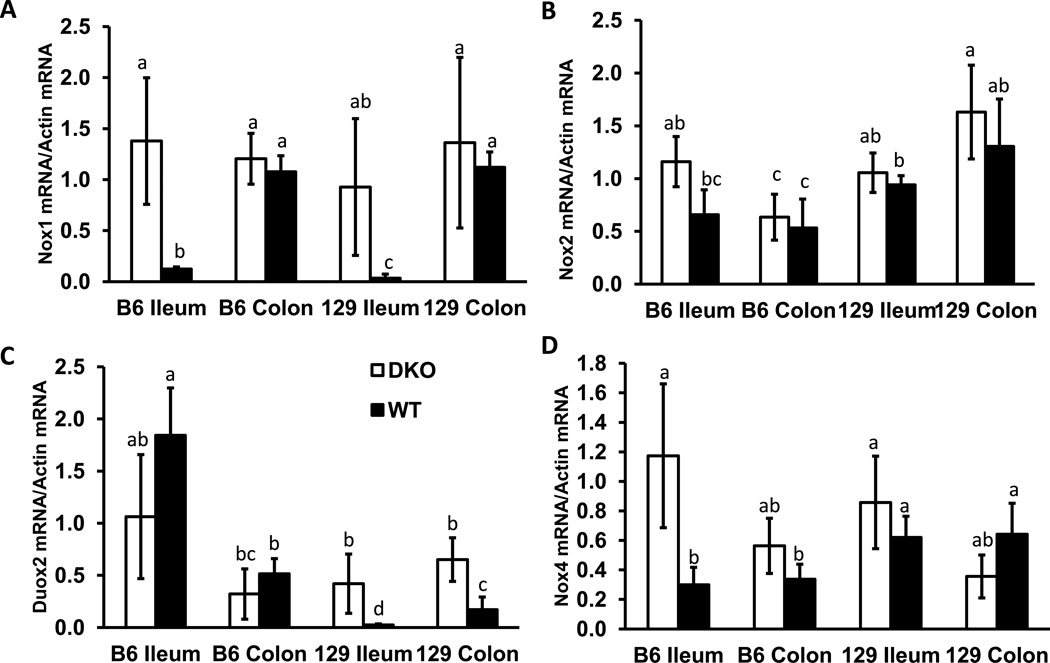
Figure 8.
Comparison of Nox1, Nox2, Duox2 and Nox4 mRNA levels in the ileum and colon of B6 and 129 DKO and WT mice at 30 days of age. The mRNA levels were normalized against β-actin. Each group has 4 mice, error bars are SD. Groups with different letters are significantly different, where a>b>c>d. The groups share the same letter are not significantly different, i.e. ab is not different from a or b, and bc is not different from b or c.

