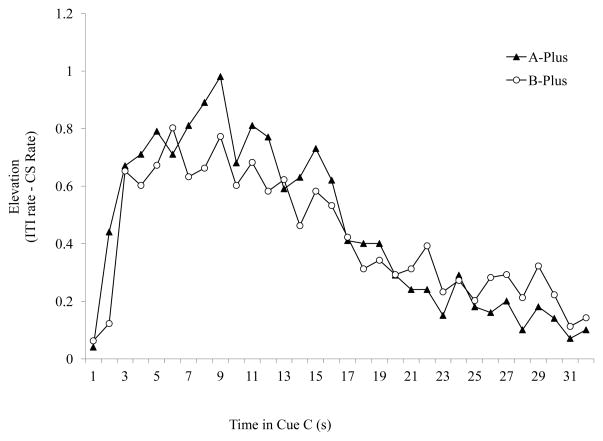
Figure 4. Experiment 2 Results.
Responding to Cue C during the test phase in groups A-Plus and B-Plus. Cue C elevation scores were calculated by subtracting the mean rate of responding during the 32 s of the ITI (ITI rate) preceding from the mean rate of responding during each second of cueC presentation. Based on the SPC training it was predicted that Group A-Plus would show increased responding earlier in the C cue than group B-Plus. However the identical pattern of responding within CS responding was observed in both groups suggesting that the pattern was likely based on generalization from FOC rather than based on temporal integration.

