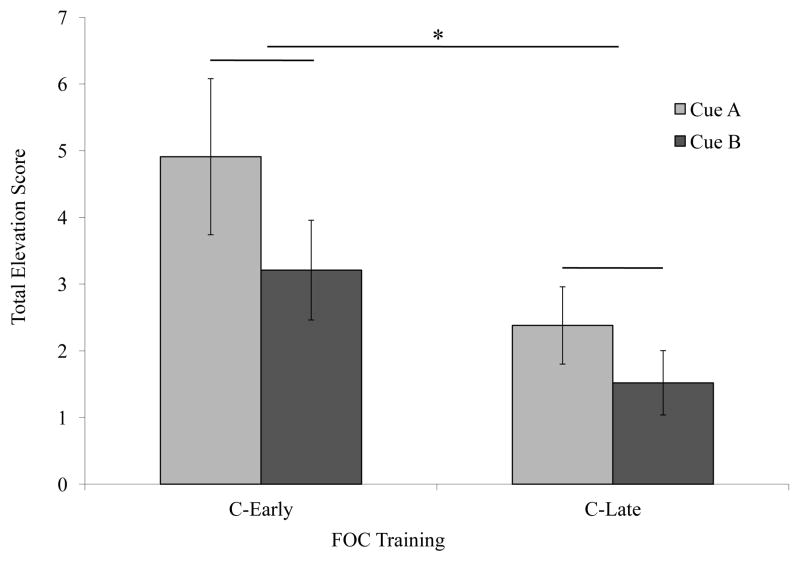
Figure 5. Experiment 2 results.
Total elevation scores represent the total rate of head poking during the cue presentation after subtracting the rate of head poking during the 16 s of ITI immediately preceding each trial. Bars represent the mean total elevation for each group. There was a significant difference in responding to the A and B cues in Group C-Early as compared to Group C-Late. There were no significant differences between the A and B cues within each of the groups. It appears then that responding to both the A and B cues was mainly determined by the FOC treatments..

