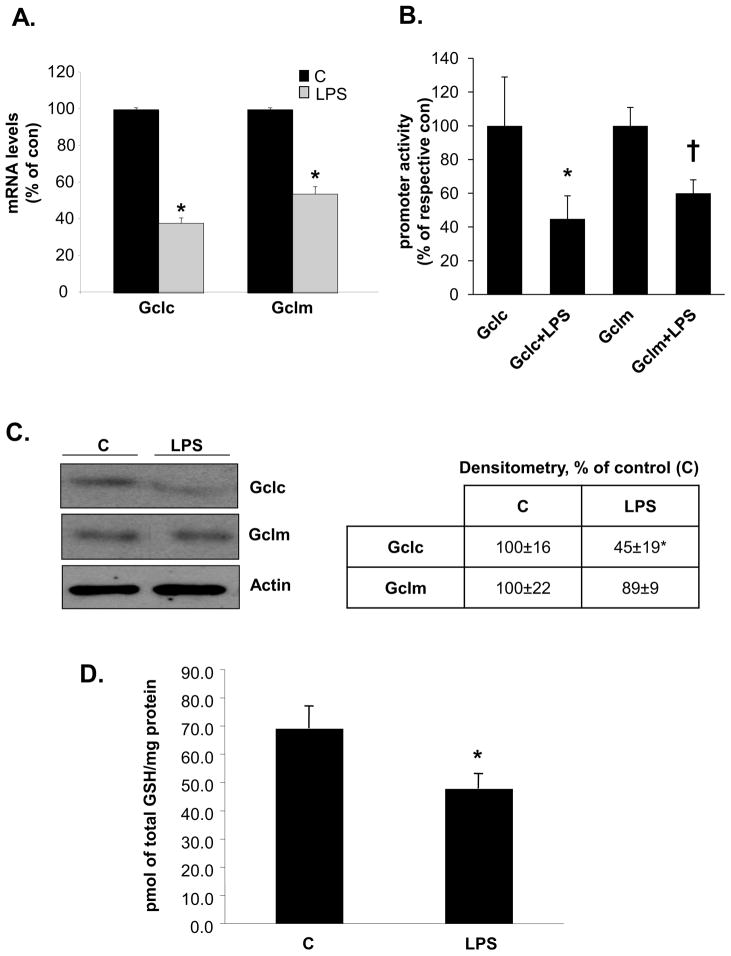
Figure 1. Effect of LPS on GCL subunits and GSH levels in RAW cells.
RAW cells were treated with LPS and processed for real-time PCR, promoter activity analysis, Western blotting and GSH level measurements as described in Methods. Part A) shows mRNA levels expressed as % of control (C) from six experiments after 4 hours of LPS treatment, *p<0.05 vs. C. Part B) shows Gclc and Gclm promoter activities expressed as % of respective control from nine experiments after 4 hours of LPS treatment, *p<0.05 vs. Gclc, †p<0.02 vs. Gclm. Part C) shows Western blot of Gclc and Gclm at 18 hours after LPS treatment. Representative blots from four separate experiments are shown and densitometric values expressed as % of control are shown in box, *p<0.05 vs. control. Part D) shows GSH levels at 18 hours after LPS treatment from three experiments, *p<0.05 vs. control.

