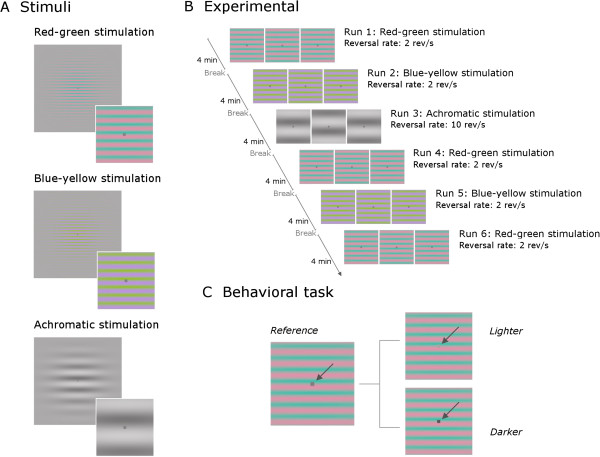
Figure 1.
Schematic diagram of the visual stimuli, experimental procedure and behavioral task. (A) Schematic diagram of visual stimuli used, with magnified insets centered on the fixation square. (B) Experimental protocol used for measurements of visual evoked potentials (VEPs). (C) The three different levels of luminance of the fixation square, shown here on the red-green stimulus. The participants had to detect a brief change in the luminance of this square from the reference luminance to a lighter or darker grey.

