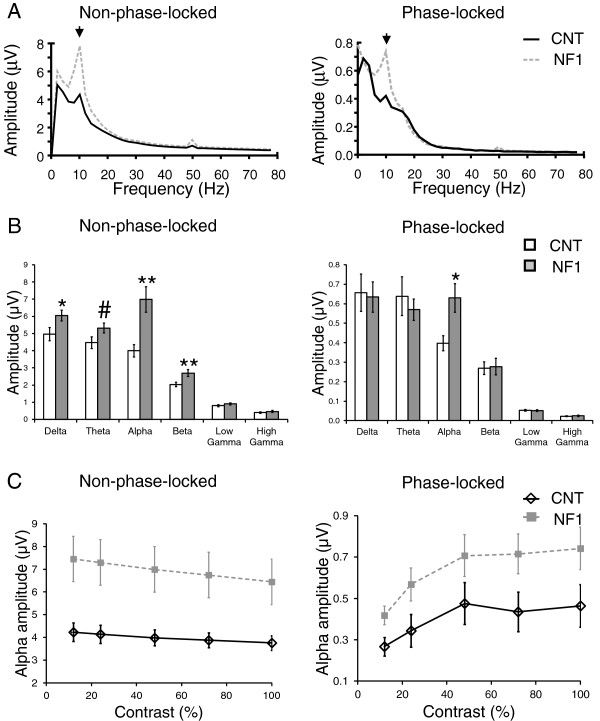
Figure 6.
Frequency domain analyses of the electroencephalographic (EEG) responses elicited by red-green stimulation revealed significantly higher amplitude of alpha oscillations in the responses of children and adolescents with neurofibromatosis type 1 (NF1) compared with control levels. (A) Grand average amplitude spectra of the EEG responses non-phase-locked (left) and phase-locked (right) with the visual stimulation. (B) Control and NF1 average amplitude of each frequency band (delta, theta, alpha, beta, low gamma and high gamma) non-phase-locked (left) and phase-locked (right) with the visual stimulation. (C) Contrast response functions of control and NF1 mean amplitude of non-phase-locked (left) and phase-locked (right) alpha oscillations. All data are represented as mean ± 1 standard error of the mean. *P <0.05; **P <0.01; #P = 0.07.

