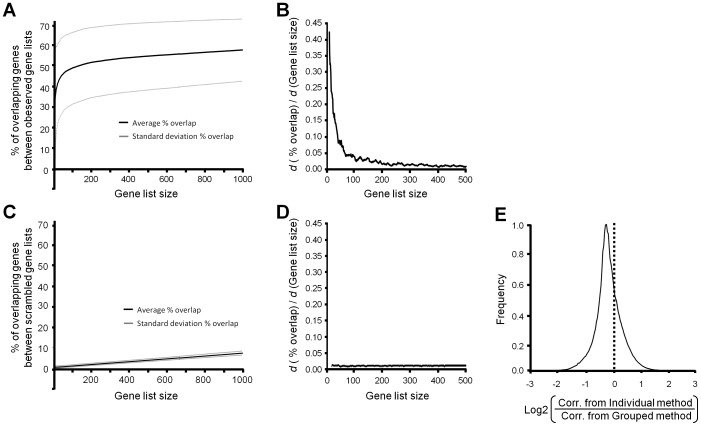
Figure 2. Determination of co-regulated genes.
A) The list of co-regulated genes was determined for each gene using the Individual and Grouped Factor Method. The two gene lists were then compared to one another by determining the % overlap (similarity) of the lists for the top 10 to top 1000 most correlated genes. The % overlap reached a plateau at 47%. B) The first derivative of the % overlap vs. the gene list size shows that on average, after comparing the top 400 genes the lists are no longer similar. C, D) This analysis was repeated for randomly generated gene lists and showed no change in the rate of % overlap vs. gene list size. E) To determine how using the Individual or Grouped Factor method effected gene-gene correlation co-efficients, we analyzed the ratio of the correlation co-efficient for each gene-gene pair. A histogram of this data shows that on average, the Grouped Factor method yielded higher correlation co-efficients.

