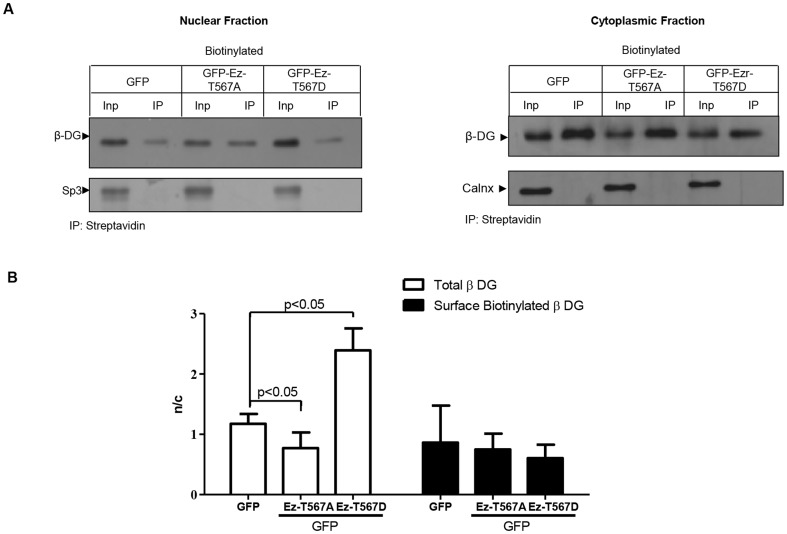
Figure 6. Subcellular distribution of cell surface-biotinylated β-dystroglycan in C2C12 myoblasts overexpressing active ezrin.
A. Cells were transfected to transitory express either ET567D-GFP, Ez-T567A-GFP or GFP alone and incubated with biotin 24 h post-transfection to label cell surface proteins, as described in Material and Methods. Cytosolic and nuclear fractions isolated from biotinylated cells were pulled-down using streptavidin-agarose beads and precipitated proteins were subjected to SDS-PAGE/Western analysis using an anti-β-DG antibody (7D11). Input, biotinylated cytosolic and nuclear extracts subjected to SDS-PAGE/Western analysis without previous streptavidin-mediated precipitation. Membranes were stripped and reprobed for calnexin (Clnx) and Sp3, loading controls for cytoplasmic and nuclear lysates respectively. B. Nuclear to cytoplasmic levels (n/c) of β-DG were quantified as per the legend to Figure 2 and results plotted represent the mean +/- SD from a series of three separate experiments, with significant differences determined by Student t-test.

