
Figure 3. Change in Realized Thermal Habitat Index among species within Canada and USA.
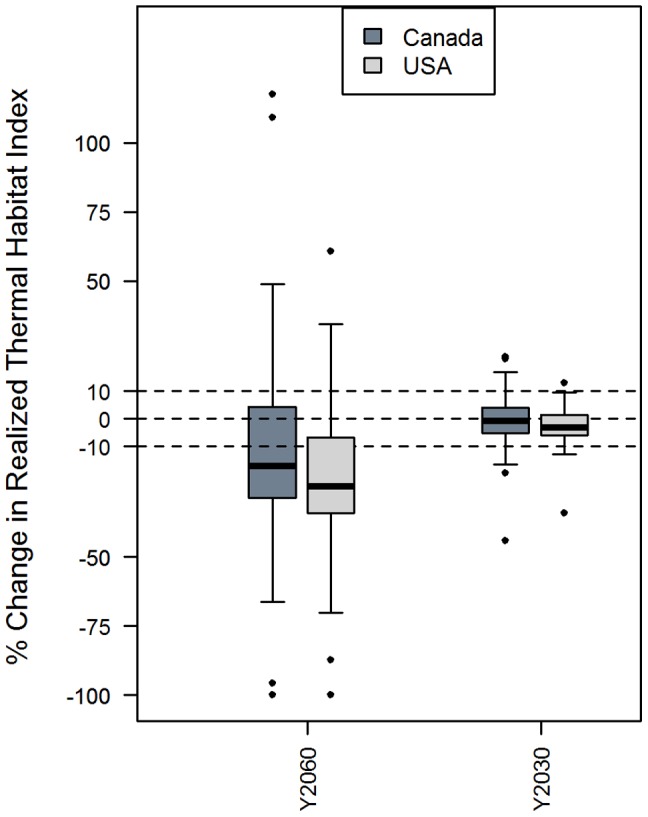
Boxplots represent distribution of net change among species within nation under the long-term (Y2060) and short-term (2030) scenarios.
Official websites use .gov
A
.gov website belongs to an official
government organization in the United States.
Secure .gov websites use HTTPS
A lock (
) or https:// means you've safely
connected to the .gov website. Share sensitive
information only on official, secure websites.
Boxplots represent distribution of net change among species within nation under the long-term (Y2060) and short-term (2030) scenarios.