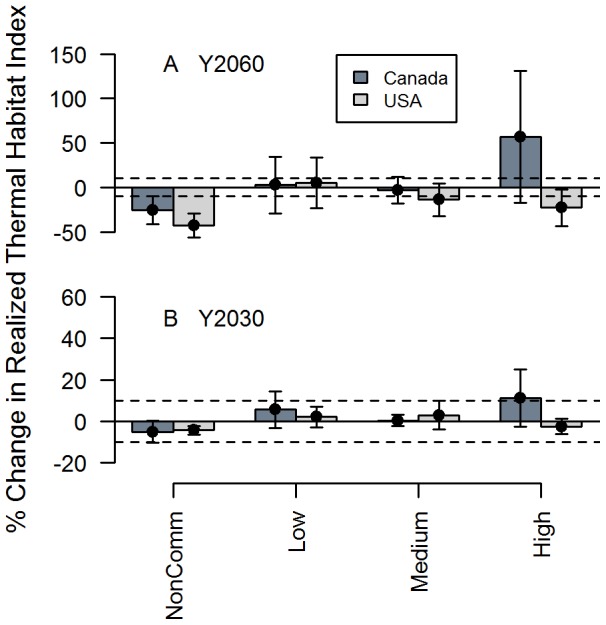
Figure 5. Change in Realized Thermal Habitat Index by commercial category in Canada and USA.

Panels depict results under the long-term (Y2060) (A) and short-term (Y2030) (B) scenarios. Commercial categories were defined by quantiles of 2011commercial value estimated separately for Canada and USA. The y-axis represents the weighted mean where the “Change in realized thermal habitat” index was weighted by species commercial value within categories. Values for each country were derived separately from 2011 commercial landing and value statistics for USA( http://www.st.nmfs.noaa.gov/commercial-fisheries/commercial-landings/monthly-landings/index) and Canada (http://www.dfo-mpo.gc.ca/stats/commercial/land-debarq/sea-maritimes/s2011av-eng.htm) and used to calculate weighted mean and confidence intervals.
