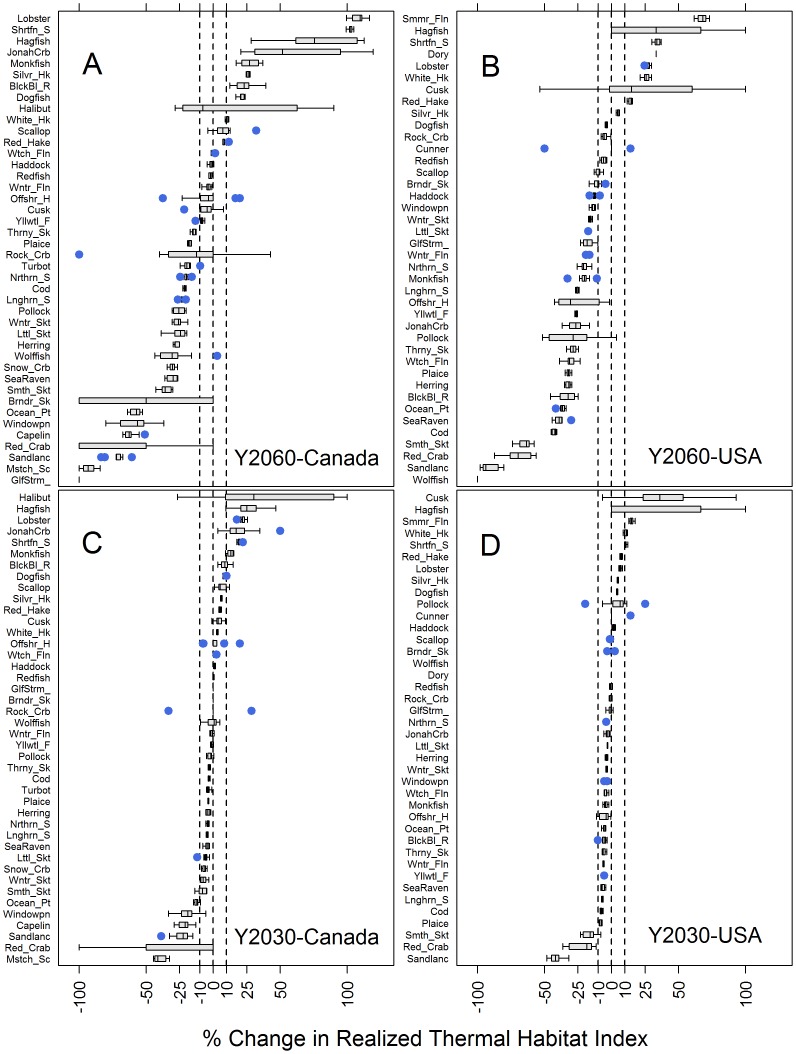
Figure 6. Change in Realized Thermal Habitat Index of individual species for long-term (2060) and short-term (2030) scenarios.
. Each boxplot represents the distribution of net change calculated from 10 models fit to subsamples of each species. Dashed lines are at 10%. Net change is considered neutral if median net change among 10 subsamples is between dashed lines. Positive outliers >100 are not shown. Change in habitat under scenario 1 (Y2060) in Canada (A) and the USA (B) and under scenario 2 (Y2030) in Canada (C) and USA (D). Abbreviated species names are listed beside full common names in Table S2.

