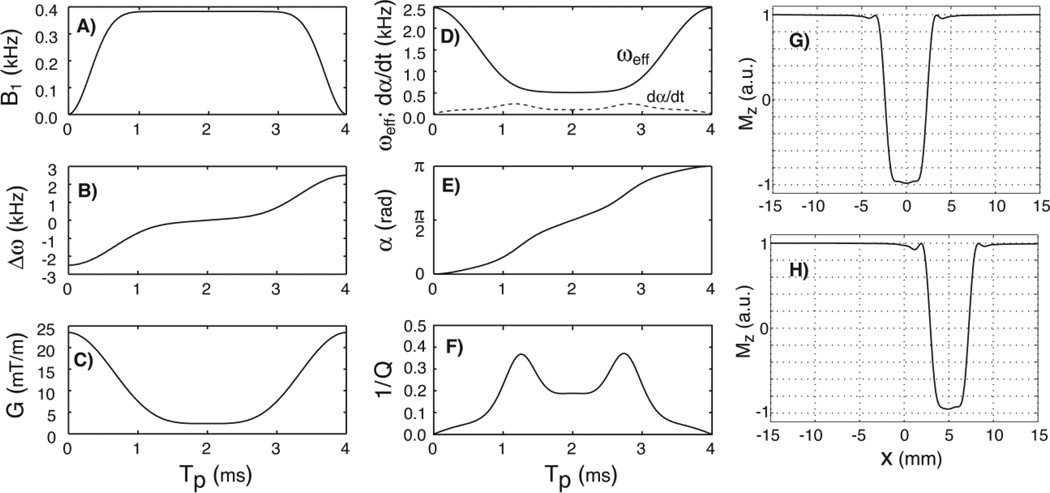
Figure 1.
Plots of GOIA-W(16,4) pulse: A) B1 amplitude modulation function; B) frequency sweep; C) gradient modulation; D) effective field; E) nutation angle; F) inverse of the adiabatic factor; G) slice profile at the isocenter; H) slice profile off-isocenter. A pulse duration of 4ms and bandwidth of 5kHz were assumed. In Fig.1D the rate of the nutation angle is also shown with the dashed line.

