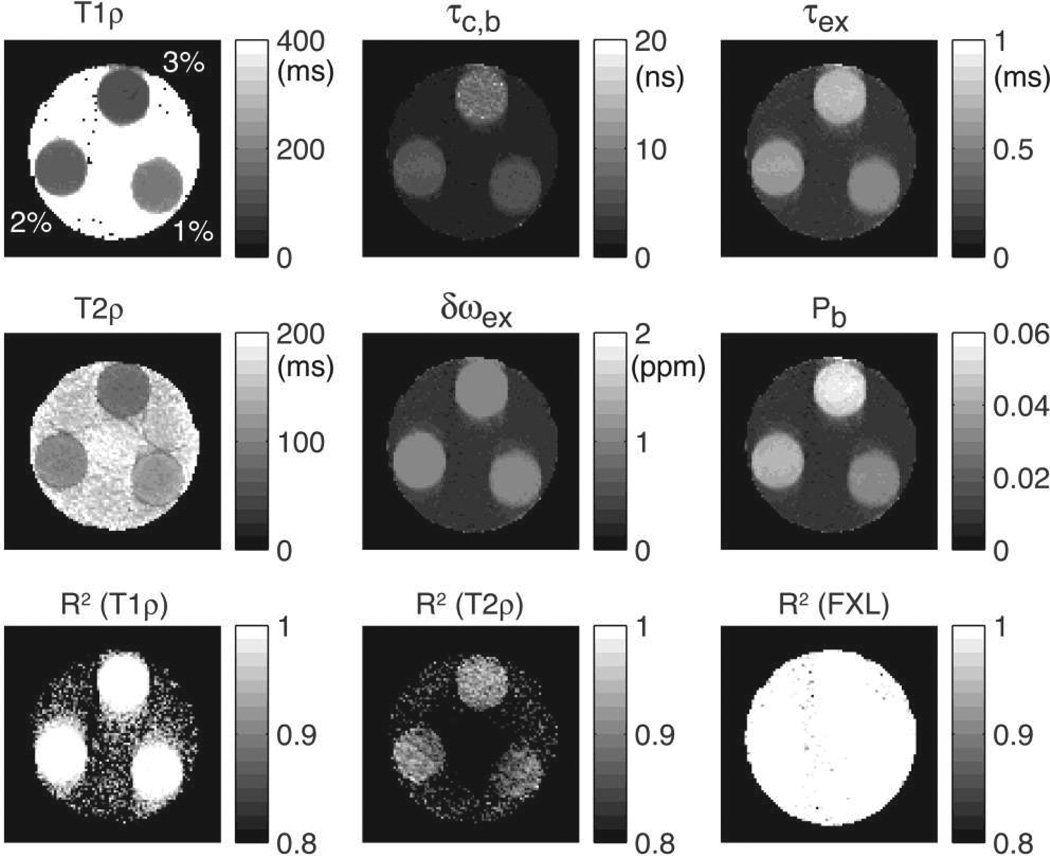
Figure 10.
Parametric maps of water molecular dynamics in a multi-compartment phantom containing three agar tubes prepared with 1%, 2% and 3% w/v. Good contrast can be seen between tubes in T1ρ, T2ρ, τc,b, τex and Pb. Chemical shift exchange frequency δωex is approximately 1 ppm in all tubes, showing, as expected, no dependency on agar concentration. Importantly, the map of water bound fraction Pb is able to distinguish a difference of 1% agar concentration. Goodness of fit is indicated by the coefficient of determination R2 showed in the bottom figures.

