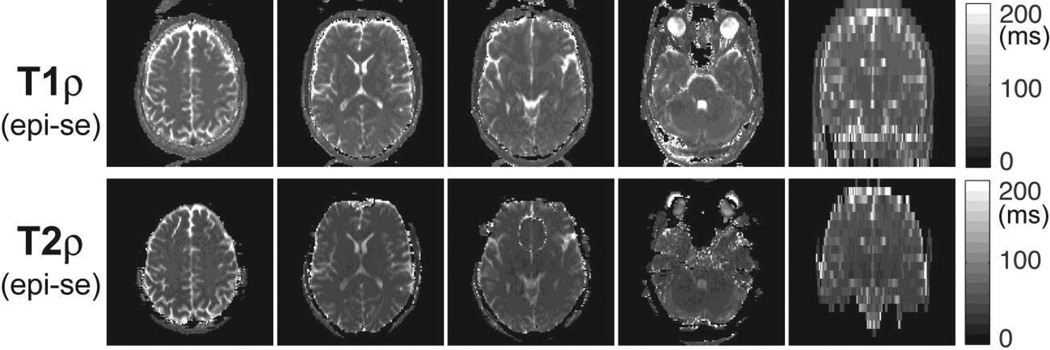
Figure 12.
2D slice selective T1ρ and T2ρ maps of the brain acquired in a volunteer. Six preparation periods of 0, 16, 32, 48, 64 and 80 ms consisting of 0, 4, 8, 12, 16 and 20 GOIA-W(16,4) pulses were acquired for 20 slices with 2D EPI-SE at 2×2×5 mm3 resolution in 1:17 min. T1ρ map shows good uniformity in all slices, while T2ρ map shows signal loss in slices at the base of the skull in regions with large susceptibility anisotropy. The coronal views on the right side indicate the prescription of slices and show no magnetization history between neighboring slices.

