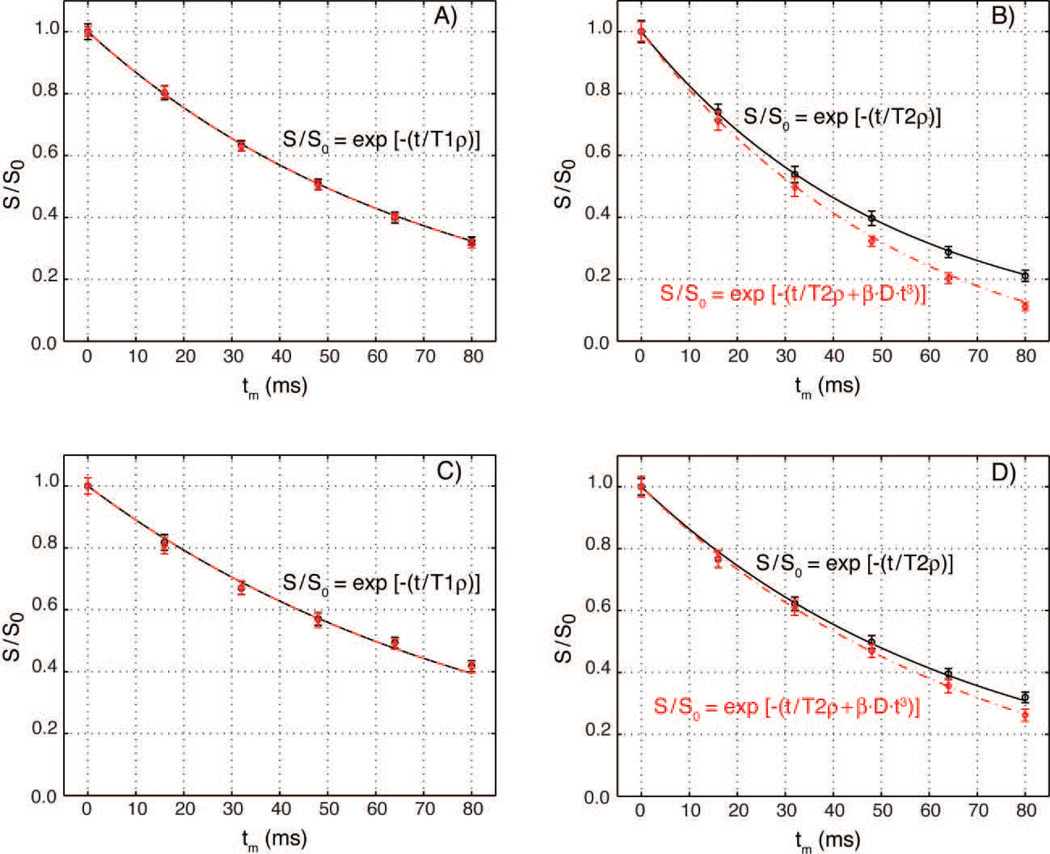
Figure 7.
Diffusion effects in slice selective T1ρ and T2ρ experiments using GOIA-W(16,4) pulses of 4 ms duration and 5 kHz bandwidth. Relaxation curves were measured with a strong gradient (23.5 mT/m, 5 mm slice, red diamonds) and a very weak gradient (0.34 mT/m, 350 mm slab, black circles). T1ρ experiments in an agar phantom (Fig. 7A) and volunteers (Fig. 7C) show no difference in relaxation curves and can be fitted with the same relaxation time constant and an exponential decay (T1ρ = 71 ms for agar, and T1ρ = 87 ms for in-vivo). T2ρ experiments show differences between relaxation curves measured with strong and weak gradients in both agar (Fig. 7B) and volunteers (Fig. 7D). Signal decay with a weak gradient can be fitted with transverse relaxation time T2ρ = 52 ms for agar and T2ρ = 68 ms for volunteers. For strong gradient an additional diffusion term has to be included in the exponential signal decay. Data can be fitted with a coefficient β = 1.87·106 mm−2·s−2, diffusion constant D = 2.1·10−3 mm2·s−1 for agar and D = 0.8·10−3 mm2·s−1 for volunteers, and the same transverse relaxation times used for the weak gradient. Diffusion constants were independently measured in the slice direction with a PGSE experiment. The difference between the weak and strong gradient transverse relaxation curves increases with diffusion constant. Error bars equal plus/minus two standard deviations.

