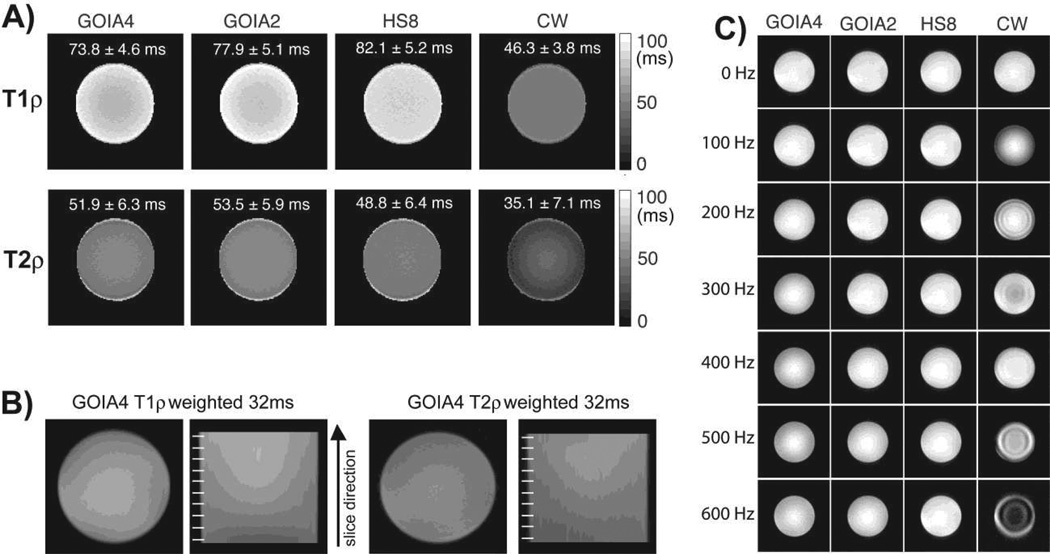
Figure 8.
T1ρ and T2ρ maps in an uniform agar phantom. Fig. 8A shows maps obtained with: i) GOIA-W(16,4) pulses of 4 ms, 5 kHz bandwidth, 0.382 kHz peak amplitude (abbrev. GOIA4), ii) GOIA-W(16,3) pulses of 2 ms, 10 kHz bandwidth, 0.821 kHz peak amplitude (abbrev. GOIA2), iii) HS8 pulses of 4 ms, 5 kHz bandwidth, 0.886 kHz peak amplitude, iv) CW spin-lock with 0.886 kHz amplitude and B1 and B0 compensation. Fig. 8B shows multislice T1ρ and T2ρ weighted images acquired with the slice selective GOIA-W(16,4) preparation. The sagittal views shown in the slice direction have good uniformity and no slice cross-talking (slice position is indicated by the white lines on the right of each sagittal image). Fig 8C show the compensation of B0 inhomogeneity. The carrier frequency during T1ρ preparation was changed as noted on the left side. It can be seen that the CW spin-lock method shows artifacts due to B0 inhomogeneity despite using a B0 and B1 compensation scheme. Adiabatic methods show good compensation of B0 inhomogeneity over the entire range of offset frequencies.

