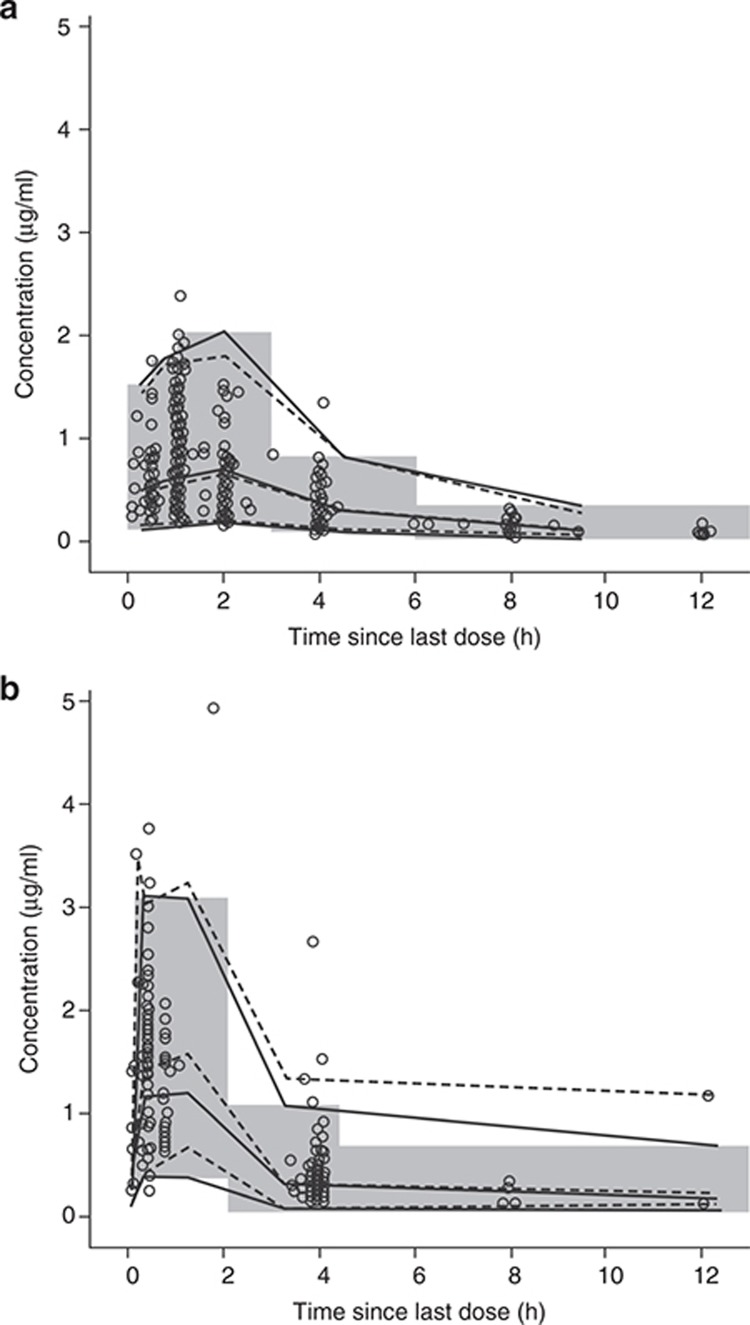
Figure 1.
Visual predictive check of the model for tobramycin concentrations. (a) Visual predictive check of the model for tobramycin concentrations at first visit of each cycle. The shaded area indicates 2.5th and 97.5th percentiles for bins over time of simulated concentrations. Open circles show observed concentrations. Solid and dashed lines indicate medians and the 2.5th and 97.5th percentiles over simulated and observed concentrations, respectively. (b) Visual predictive check of the model for tobramycin concentrations at second visit of each cycle. Open circles show observed concentrations. Dashed lines indicate medians and the 2.5th and 97.5th percentiles over observed concentrations. The solid lines indicate medians and the 2.5th and 97.5th percentiles over simulated concentrations, and the shaded rectangles illustrate binned time intervals over which the percentiles were evaluated.

